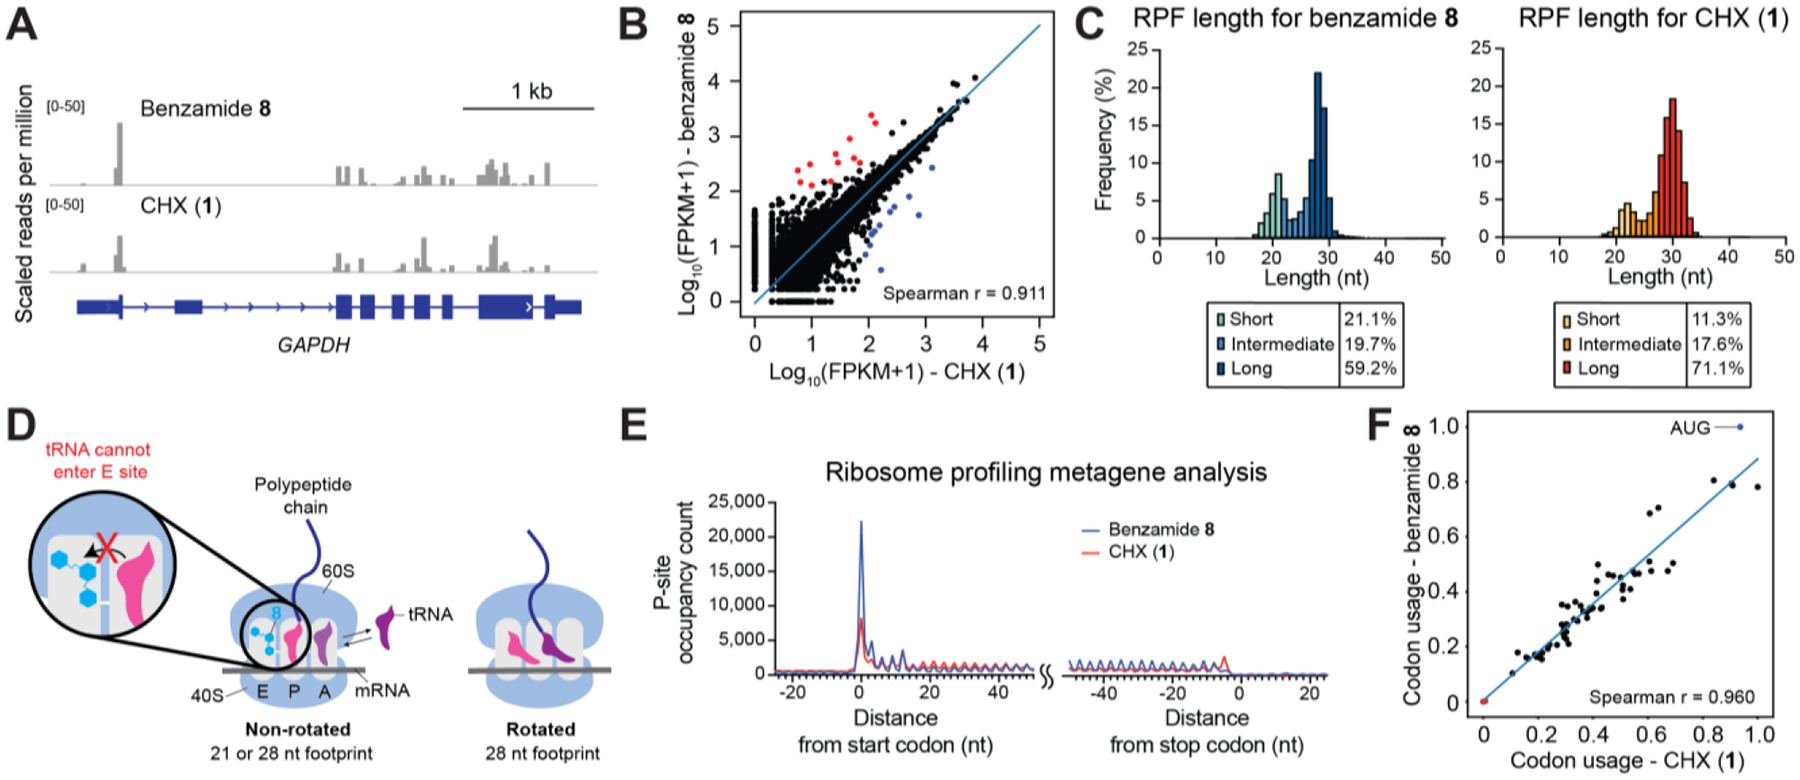
Figure 4.

Benzamide 8 is effective in ribosome profiling. (A) Genome browser tracks showing mapped footprints at the GAPDH locus. (B) Scatter plot comparing ribosome density of 8-treated cells and that of CHX-treated cells (FPKM = fragments per kilobase million; Spearman correlation=0.911). Each dot represents a gene with >1 mapped footprint. Out of 20,737 genes, 12 whose mapped footprints were enriched (red) and 11 depleted (blue) in the presence of 8 versus CHX (cutoff: |log2(fold change)|>1, adjusted p-value<0.05). The blue line represents linear regression of log-transformed data. (C) Histogram of footprint length isolated from 8- (left) or CHX-treatment (right). (D) Proposed model where 8 sustainably stabilizes the non-rotated conformation and enriches the 21 nt footprint. By contrast, CHX inhibition is rapidly reversible, allowing transition to the rotated conformation and greater preponderance of longer footprints. (E) Metagene profile showing average P-site occupancy counts of footprints across all detected transcripts. (F) Scatter plot comparing codon usage of 8- or CHX- treated cells (Spearman correlation=0.960). Start codon:blue dot; stop codons: red dots. The blue line represents linear regression.
