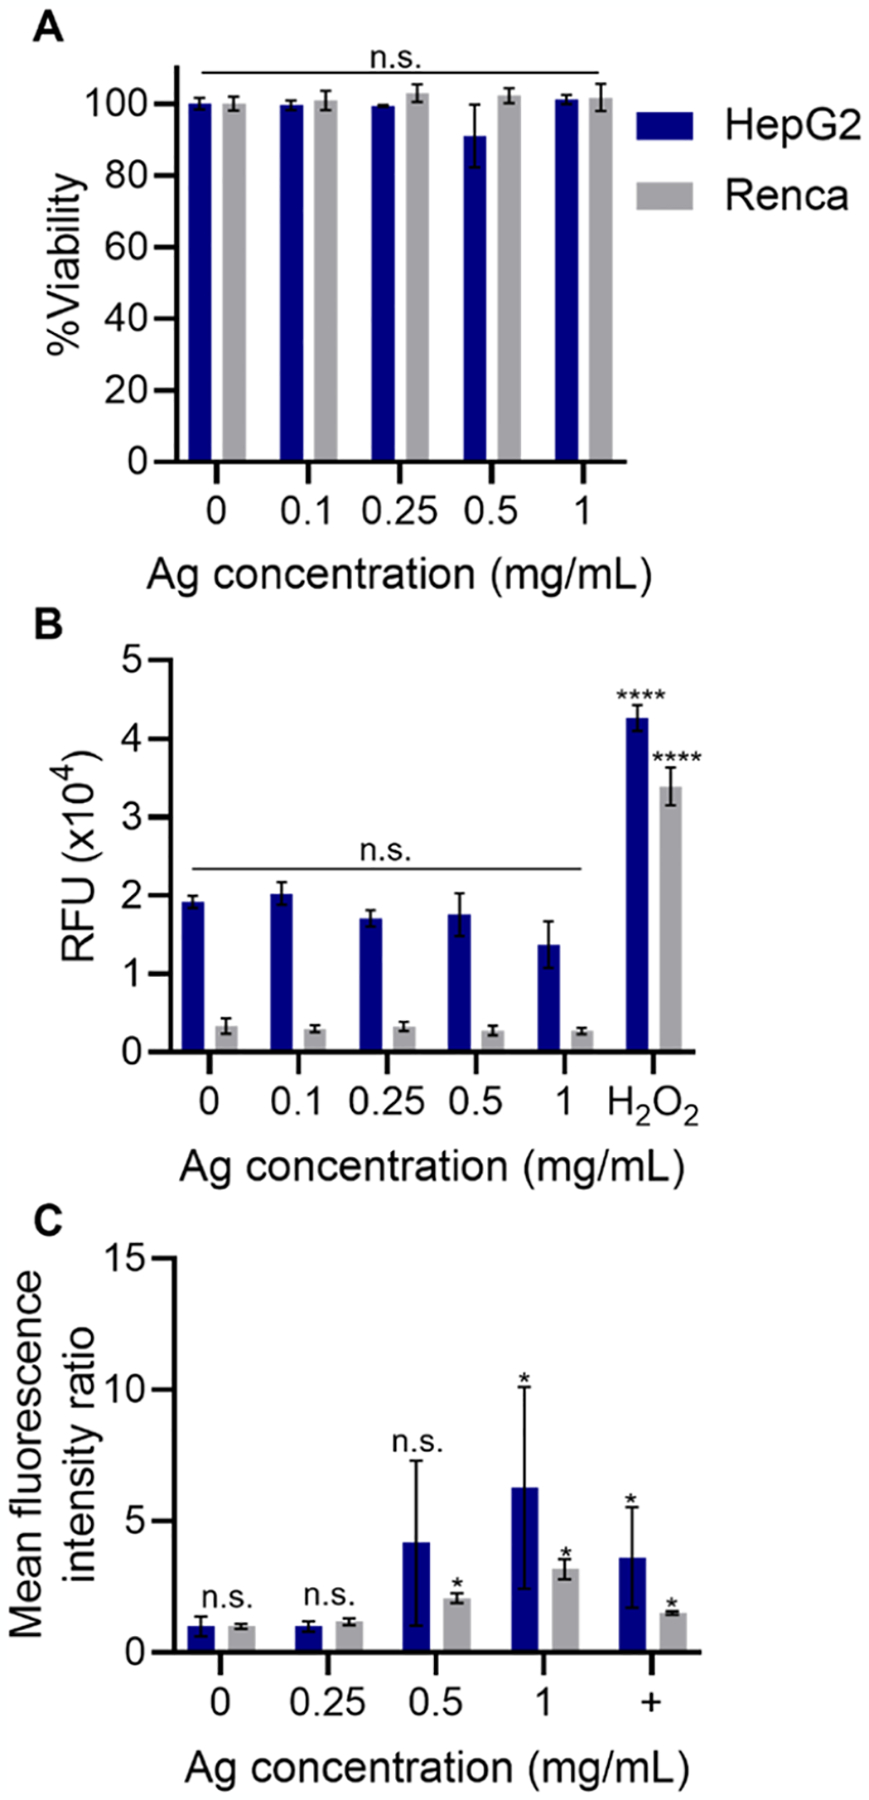
Figure 2.

In vitro biocompatibility assays. (A) Viability of kidney (Renca) and liver (HepG2) cells in gray and blue, respectively, (B) ROS generation of kidney cells and liver cells in gray and blue, respectively, and (C) immunofluorescence staining of γH2AX in kidney and liver cells in gray and blue, respectively, after incubation with GSH-coated Ag2Te NPs at different Ag concentrations. In (C), + denotes positive controls (cells irradiated with a dose of 6 Gy 30 min prior to staining). Data are presented as mean ± SD. Statistical significances are compared to the control. *p < 0.05. ****p < 0.0001. n = 3 per condition and cell line.
