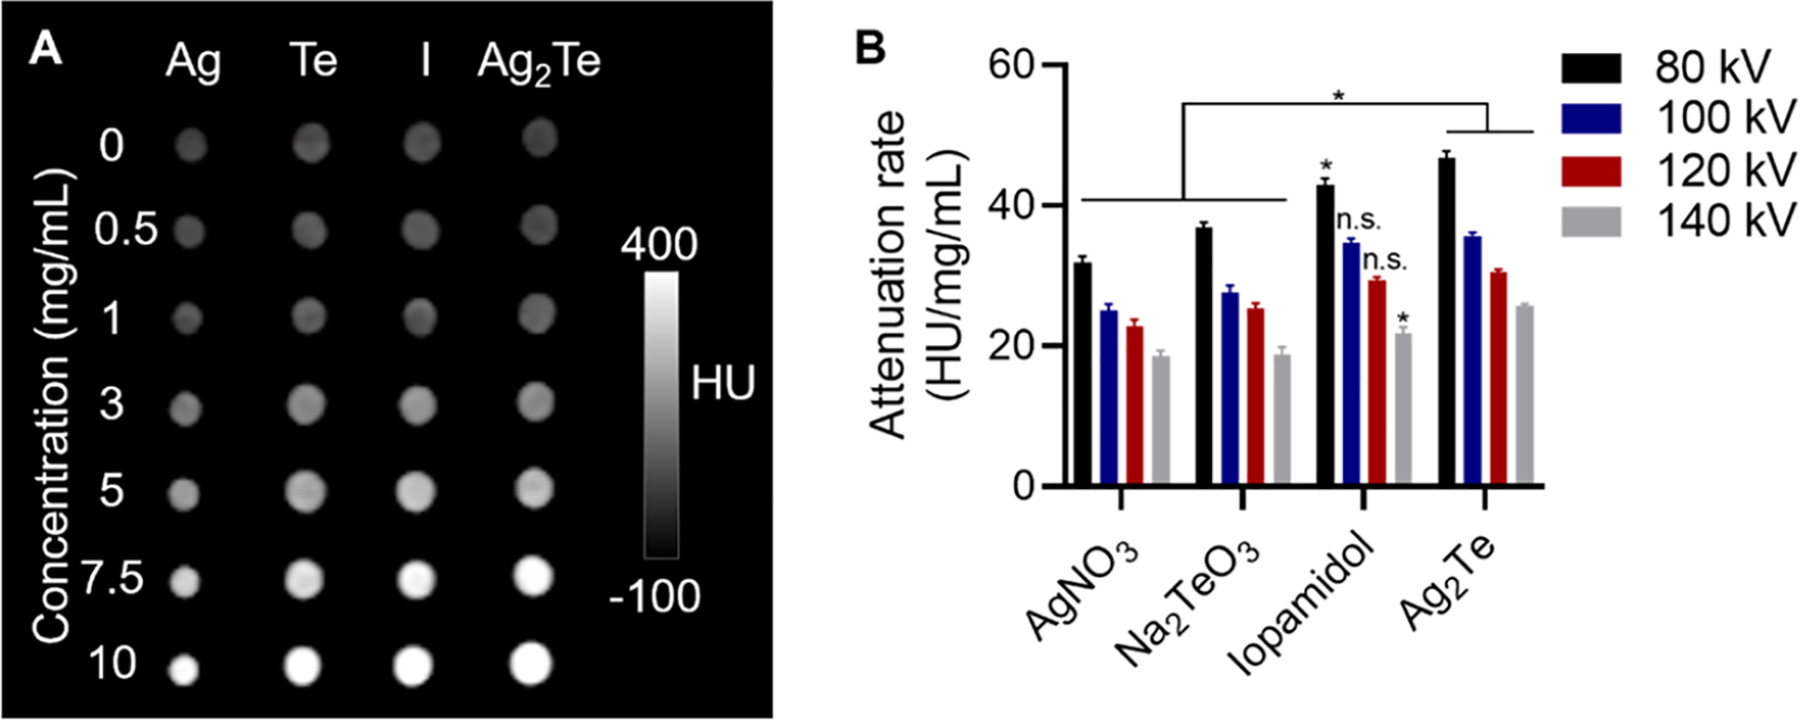
Figure 3.

In vitro CT imaging: (A) Representative CT images of AgNO3 (Ag), Na2TeO3 (Te), Iopamidol (I), and sub-5 nm GSH-coated Ag2Te NPs solutions at different concentrations (ranging from 0 to 10 mg/mL) at an X-ray tube voltage of 80 kV. (B) Quantification of the CT attenuation rate for the different solutions at varying X-ray tube voltages. Data are presented as mean ± SD. *p < 0.05, n = 3 per group.
