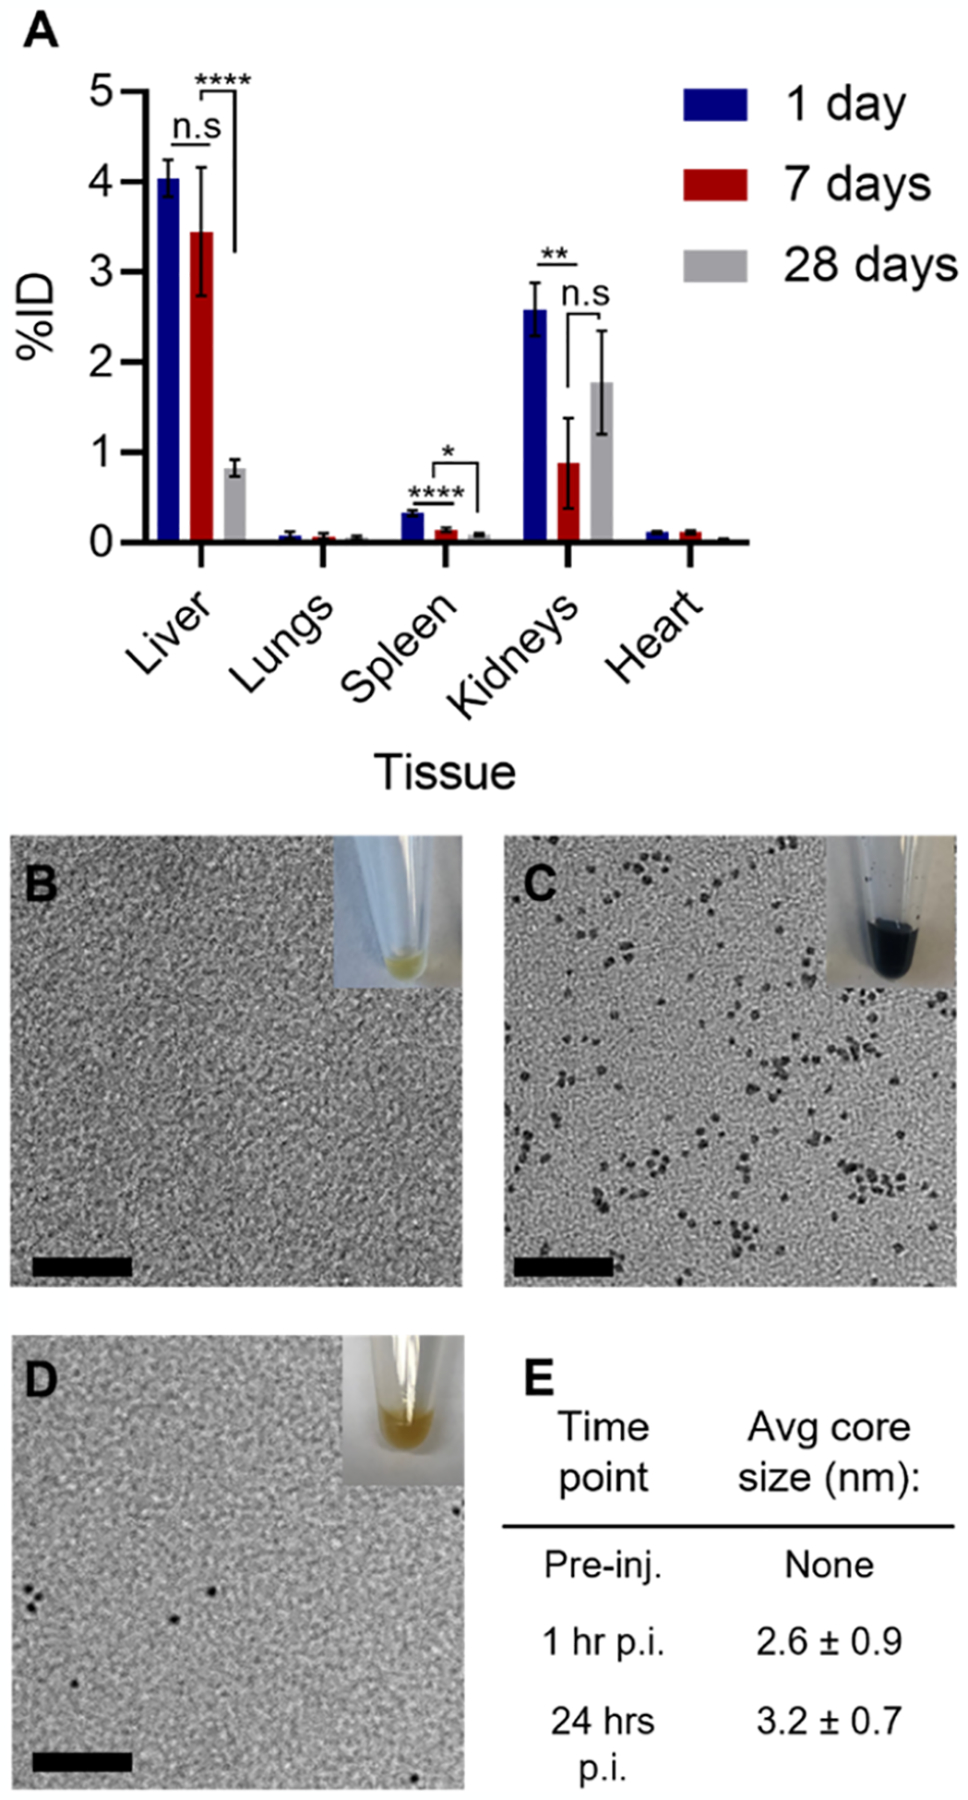
Figure 5.

(A) Biodistribution at different times post-injection of sub-5 nm GSH-coated Ag2Te NPs; n = 5 per group. Data are presented as mean %ID ± standard error of mean (SEM). Representative TEM micrograph of urine collected from the mice injected with sub-5 nm GSH-coated Ag2Te NPs (B) pre-injection, (C) 60 min post-injection, and (D) 24 h post-injection. (E) Table showing the average core size of nanoparticle micrographs in (B–D). Inset: photograph of representative urine collected at the described time point. Scale bar represents 20 nm.
