Figure 6.

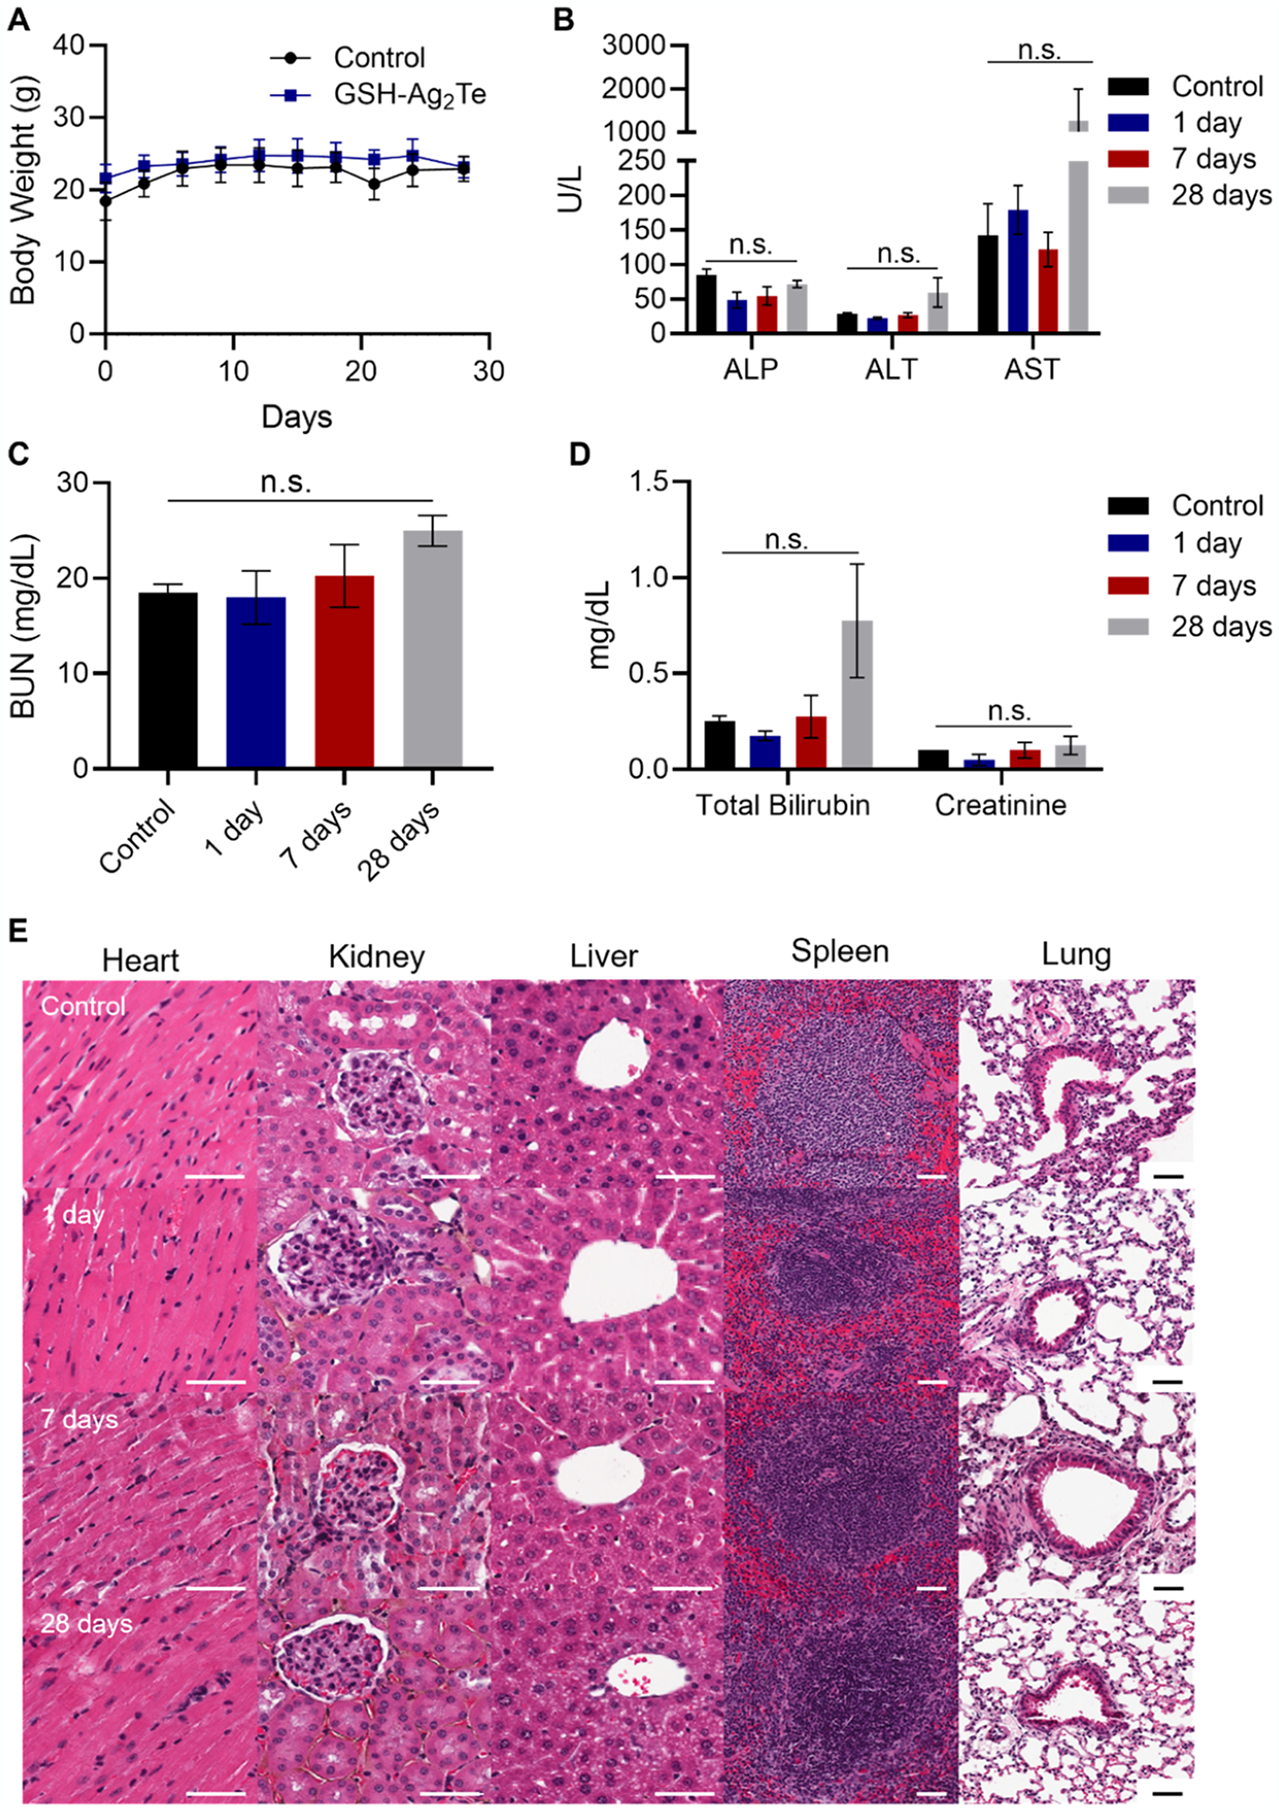
In vivo toxicology. (A) Body weight of control mice (uninjected) and GSH-Ag2Te-treated mice over 28 days. (B–D) Serum chemistry panels of mice injected with either PBS or GSH-Ag2Te at different times post-injection. Serum levels of (B) alkaline phosphatase (ALP), alanine aminotransferase (ALT), and aspartate aminotransferase (AST), (C) blood urea nitrogen (BUN), and (D) total bilirubin and creatinine in the different mice groups. Data are presented as mean ± SEM. (E) Representative histology (H&E staining) micrographs of mice organs after injection with either PBS or GSH-coated Ag2Te NPs at different times post-injection. n = 5 per group. Scale bar = 50 μm.
