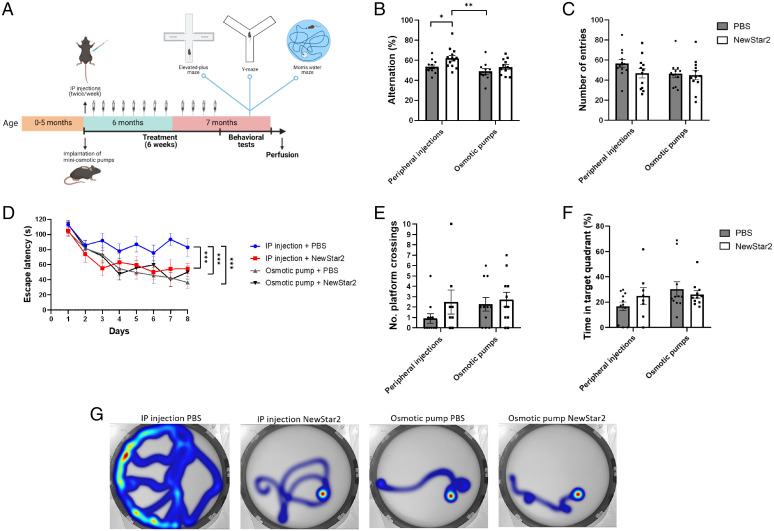
Fig. 1.
NewStar2 improves working and spatial memory. (A) Timeline of experimental procedures. (B) Alternation (%) tested in the Y-maze spontaneous alternation (IP injections: PBS, n = 13, NewStar2, n = 13; osmotic pumps: PBS, n = 11, NewStar2, n = 12; two-way ANOVA, Bonferroni post hoc analysis: F1,45 = 7.81, degrees of freedom [DF] = 1). (C) Number of entries in the Y-maze spontaneous alternation (IP injections: PBS, n = 13, NewStar2, n = 13; osmotic pumps: PBS, n = 11, NewStar2, n = 12; two-way ANOVA, Bonferroni post hoc analysis: F1,45 = 1.88, DF = 1). (D) Escape latency(s) during the training phase of the MWM (IP injections: PBS, n = 11, NewStar2, n = 8; osmotic pumps: PBS, n = 11, NewStar2, n = 11; two-way repeated measures ANOVA, Bonferroni post hoc analysis: F3,37 = 4.37, DF = 3). (E) Number of platform crossings during the probe trial (IP injections: PBS, n = 11, NewStar2, n = 8; osmotic pumps: PBS, n = 11, NewStar2, n = 11; two-way ANOVA, Bonferroni post hoc analysis: F1,37 = 1.19, DF = 1). (F) Time in target quadrant during the probe trial (IP injections: PBS, n = 11, NewStar2, n = 8; osmotic pumps: PBS, n = 11, NewStar2, n = 11; two-way ANOVA, Bonferroni post hoc analysis: F1,37 = 2.41, DF = 1). (G) Representative heat maps showing swimming trajectories at day 8 of training. The platform was located in the southeast quadrant. Data are presented as mean ± SEM. *P < 0.05; **P < 0.01; ***P < 0.001. Panel A was created with BioRender.com.

