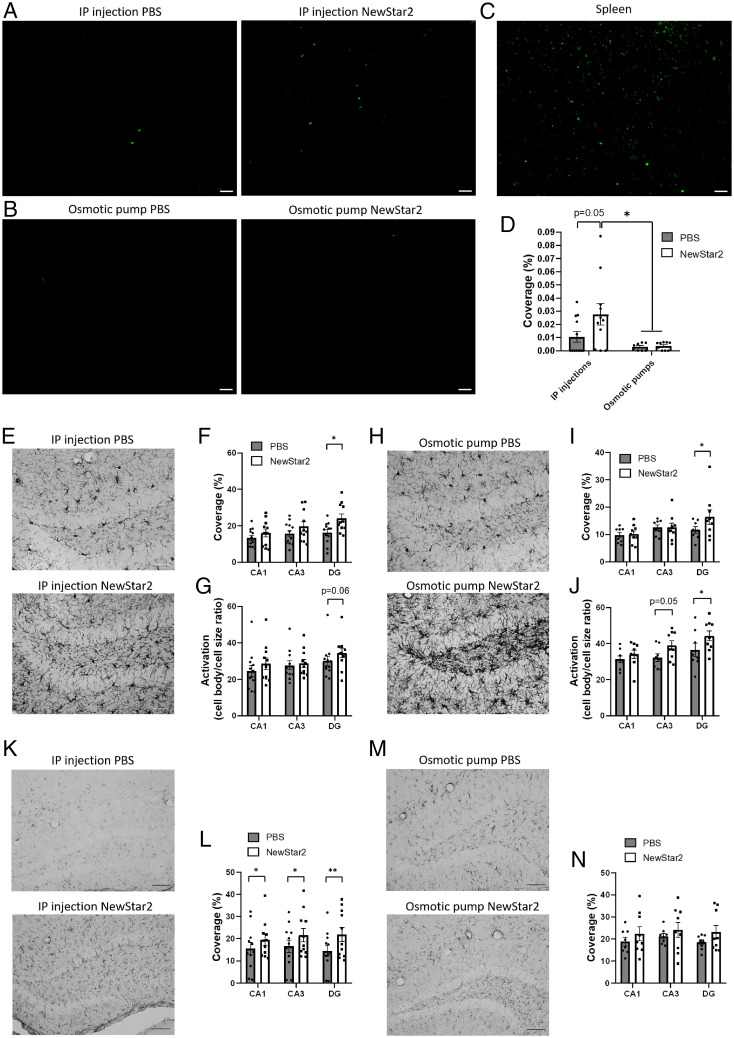
Fig. 3.
Tregs infiltration and microglial and astrocytic activation are increased after peripheral NewStar2 administration. (A and B) Hippocampal sections from mice treated with PBS or NewStar2 via IP injections or osmotic pumps were stained with Foxp3 (green) for Tregs. Representative images of hippocampus are shown. Scale bar, 50 µm. (C) Spleen sections, which regularly contain Tregs, were stained with Foxp3 (green) as a positive control. Scale bar, 50 µm. (D) Quantification of Foxp3 coverage in hippocampus (IP injections: PBS, n = 12, NewStar2, n = 11; osmotic pumps: PBS, n = 8, NewStar2, n = 9; two-way ANOVA, Bonferroni post hoc analysis: F1,36 = 2.91, degrees of freedom [DF] = 1). (E and H) IBA-1 microglia after PBS or NewStar2 administration via IP injections (E) or osmotic pumps (H). Representative images of DG are shown. Scale bar, 100 µm. (F) Quantification of microglia (IBA-1) coverage from CA1, CA3, and DG, shown in E (IP injections: PBS, n = 12, NewStar2, n = 11; two-way ANOVA, Bonferroni post hoc analysis: F1,63 = 8.72, DF = 1). (G) Quantification of microglial activation from CA1, CA3, and DG, shown in E (IP injections: PBS, n = 12, NewStar2, n = 11; two-way ANOVA, Bonferroni post hoc analysis: F1,63 = 2.05, DF = 1). (I) Quantification of microglia coverage from CA1, CA3, and DG, shown in H (osmotic pumps: PBS, n = 8, NewStar2, n = 9; two-way ANOVA, Bonferroni post hoc analysis: F1,45 = 6.24, DF = 1). (J) Quantification of microglial activation from CA1, CA3, and DG, shown in I (osmotic pumps: PBS, n = 8, NewStar2, n = 9; two-way ANOVA, Bonferroni post hoc analysis: F1,45 = 7.11, DF = 1). (K and M) GFAP astrocytes after PBS or NewStar2 administration via IP injections (K) or osmotic pumps (M). Representative images of DG are shown. Scale bar, 100 µm. (L) Quantification of astrocytes (GFAP) coverage from CA1, CA3, and DG, shown in K (IP injections: PBS, n = 12, NewStar2, n = 11; two-way ANOVA, Bonferroni post hoc analysis: F1,63 = 5.76, DF = 1). (N) Quantification of GFAP coverage from CA1, CA3, and DG, shown in M (osmotic pumps: PBS, n = 8, NewStar2, n = 9; two-way ANOVA, Bonferroni post hoc analysis: F1,45 = 3.03, DF = 1). Data are presented as mean ± SEM. *P < 0.05; **P < 0.01.

