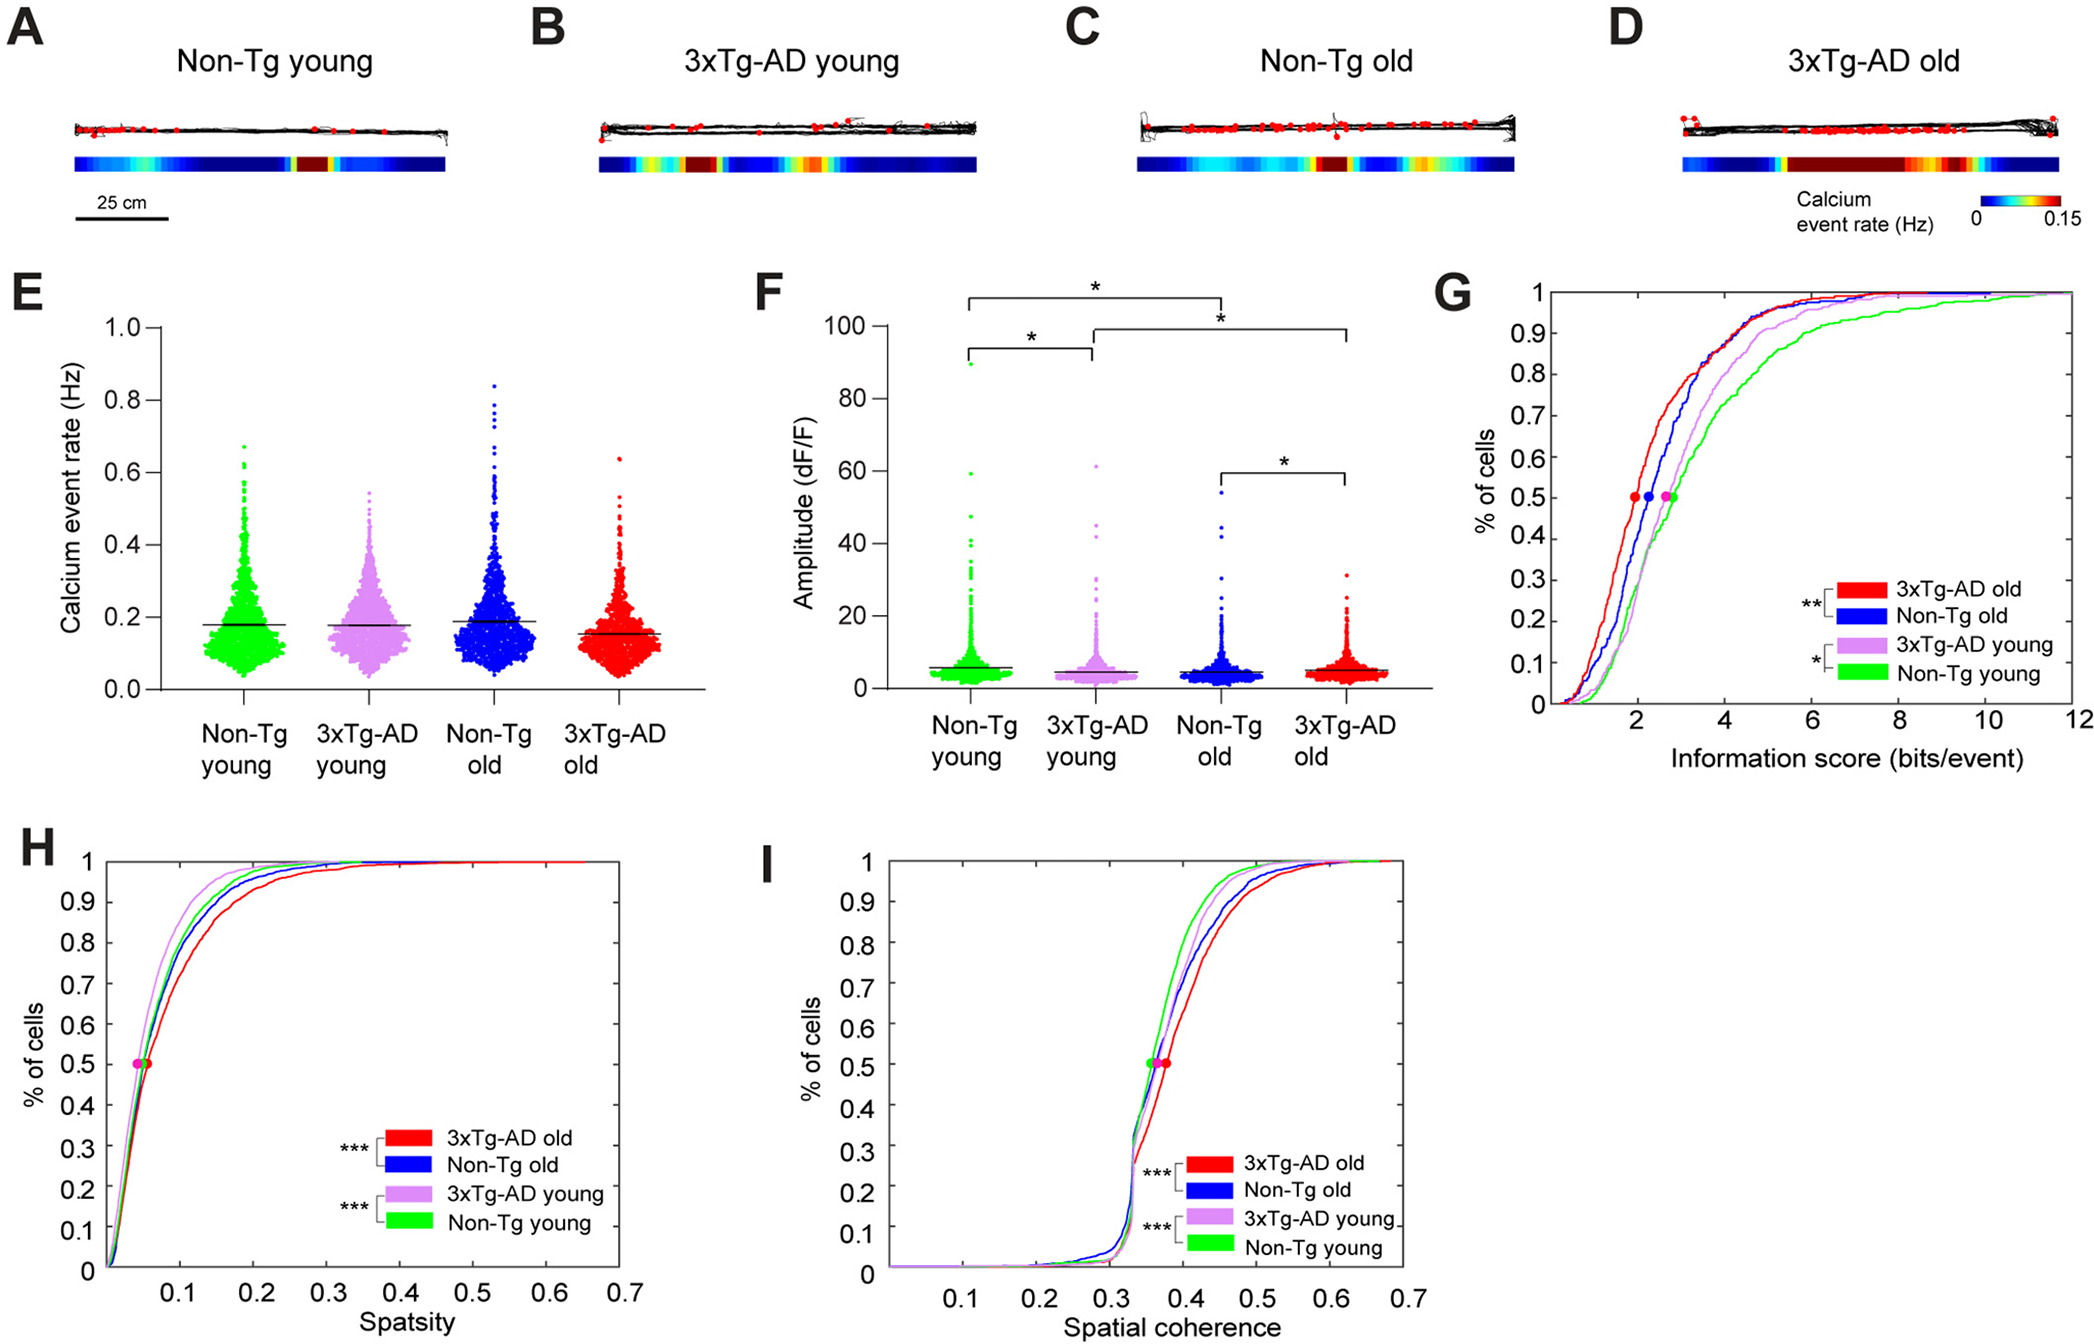
Fig. 4.

Linear track experiment data also support impaired spatial coding in 3xTg-AD hippocampal CA1. A-D. Example calcium event rate maps from mice running on a horizontal linear track with different genotypes and ages. Top: the black line represents the movement trajectory of mice. Superimposed red dots represent the locations where calcium events occur. Bottom: smoothed spatial rate maps. E. Violin plots of calcium event rates of all neurons from different groups of mice. Only the periods with movement speeds higher than 5 mm/s were used for event rate calculation, and event rates from trials with the same track direction were averaged. F. Violin plots of calcium event amplitudes of all neurons from different groups of mice. G. Cumulative distribution plots of spatial information scores (in bits/event) for all place cells from Non-Tg old, 3xTg-AD old, Non-Tg young and 3xTg-AD young mice, for both horizontal and vertical tracks in two directions. H and I. Cumulative distribution plots of sparsity (H) spatial coherence (I) values of all neurons for Non-Tg old, 3xTg-AD old, Non-Tg young and 3xTg-AD young mice, in both square and circle arena. LME analyses were used for E-F; two-sample Kolmogorov-Smirnov tests were used for G-I. *, ** and *** indicate the significance levels with the respective p values of <0.05, <0.005, and < 0.0005.
