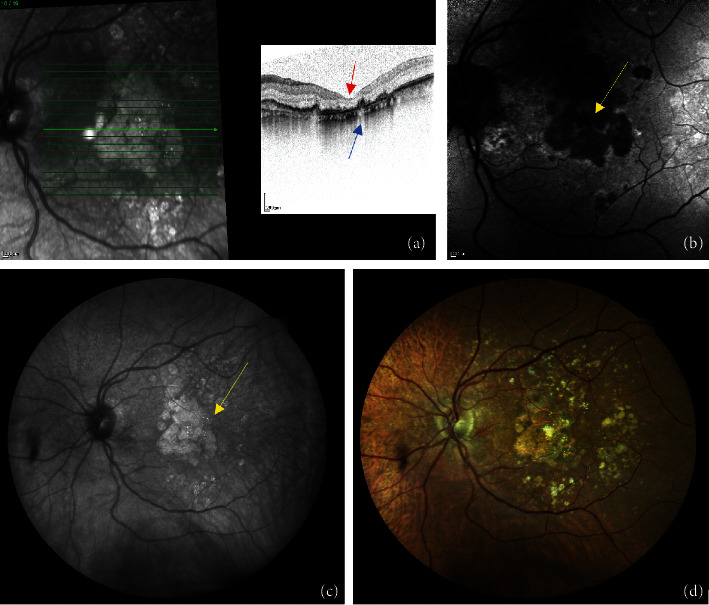
Figure 1.

Multimodal imaging of GA as follows: (a) Heidelberg OCT of a GA shows the backscattering of the RPE, blue arrow, and the thinning of the IS/OS, red arrow; (b) AF of a GA lesion acquired with Heidelberg device, seen as hypofluorescent dark area, yellow arrow; (c) IR image of a GA taken with CMP shows GA as a white, hyper-reflective region, yellow arrow; and (d) photo fundus realized with CMP.
