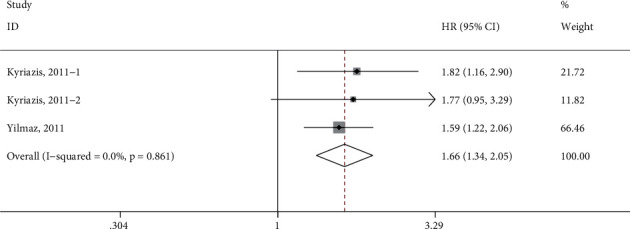
Figure 3.

Forest plot of the association between per 1-SD decrease in free testosterone and the overall adverse events. HR, hazard risk; CI, confidence interval.

Forest plot of the association between per 1-SD decrease in free testosterone and the overall adverse events. HR, hazard risk; CI, confidence interval.