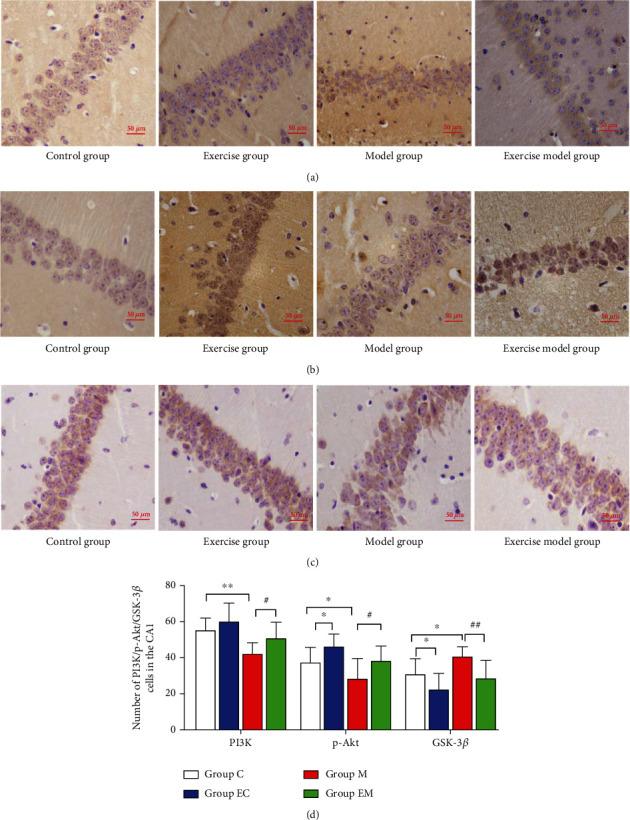
Figure 3.

Number of PI3K-, p-Akt-, and GSK-3β-positive neurons in hippocampal CA1 of each group of mice. (a–c) PI3K, P-Akt, and GSK-3β immunohistochemical results of the hippocampal CA1 region in each group. (d) The number of immunohistochemical-positive cells in the hippocampal CA1 area of each group. Results are mean ± SD (n = 8/group). ∗P < 0.05 and ∗∗P < 0.01 vs. group C; #P < 0.05 and ##P < 0.01 vs. group M. Scale bar: 50 μm.
