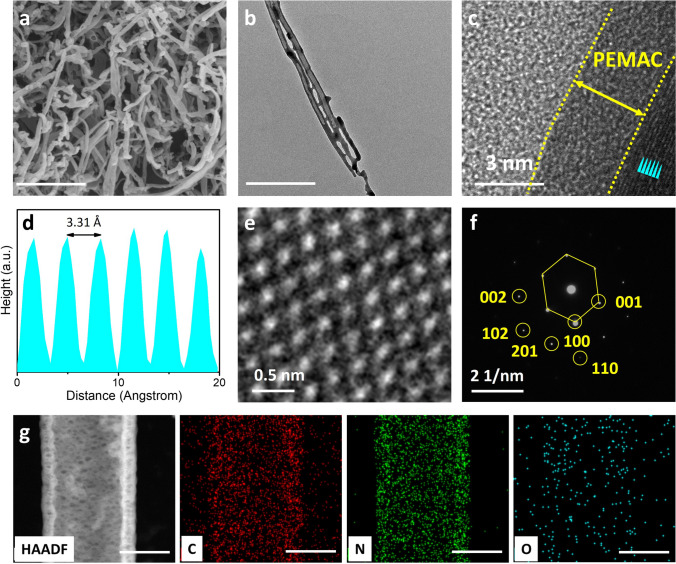
Fig. 2.
Structural characterizations of PEMAC@NDCN. a SEM image and b STEM image of PEMAC@NDCN free-standing catalysts. c High-resolution STEM image. d Topographic interplanar spacing profiles of stated cyan region in (c). e Enlarged HRTEM image defining hexagonal crystal structure. f SAED pattern along with different crystal orientations. g HAADF-STEM image with elemental maps of C, N, and O in the PEMAC@NDCN. Scale bars, a 500 nm, b 300 nm, and g 50

