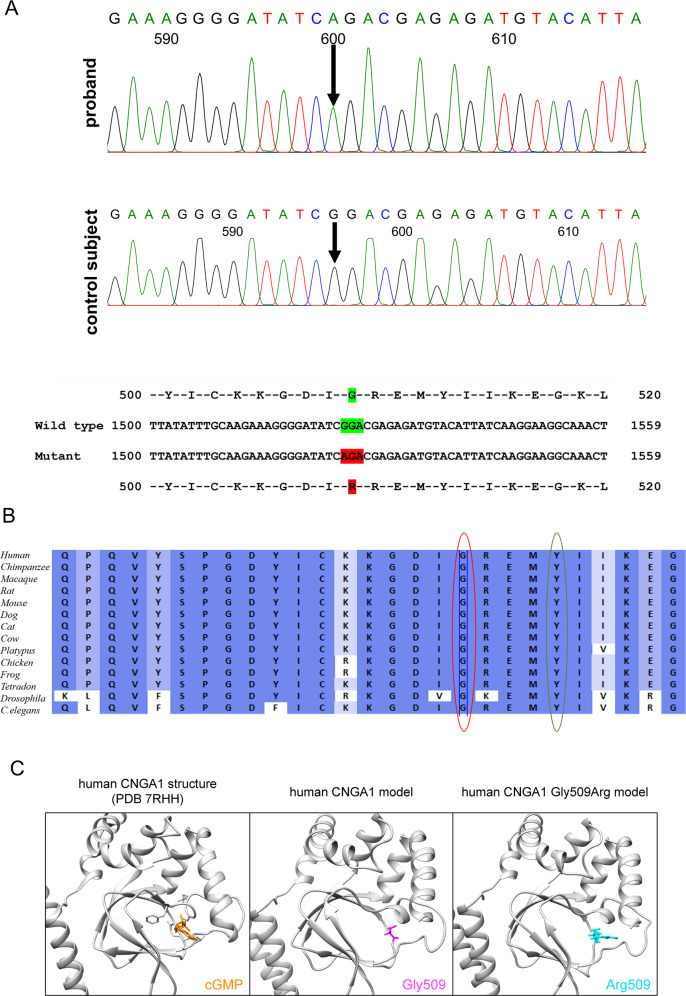
Fig. 2. Identification of CNGA1 mutation.
A Sequence chromatogram of the proband (top) and control subject from the south Indian population (middle) and CNGA1 exon 10 (bottom), depicting the homozygous mutation (c.1525 G > A; p.Gly509Arg); the mutant and wild-type peaks “A” and “G” are marked by arrows. The missense mutation (marked in red) is compared with the wild-type sequence (marked in green) together with the translated protein sequences. B Amino acid sequence alignment of human CNGA1 and orthologues from other species, depicting a high conservation of p.G509 (encircled in red). Divergent amino acid residues are shaded in white color background. C Structural comparison of wild-type and mutant human CNGA1 (backbone is shown in grey). The amino acid of interest in the wild-type structure (Gly513, magenta) and mutant structure (Arg513, cyan) (which is position at 509 in the MANE transcript encoded protein (NP_001366199.1) are shown as atoms. As reference structure the CNGA1 subunit of the human PDB 7RHH [20] is shown with bound cGMP (orange, shown as atom) and the residues R561, T562, A563, F544, E546, I547, S548 (grey, shown as atoms) are responsible for cGMP binding. Models were generated using the RoseTTAfold deep learning algorithm [19] available at https://robetta.bakerlab.org/. The generated 3D models were visualized using the UCSF Chimera software (https://www.cgl.ucsf.edu/chimera/).

