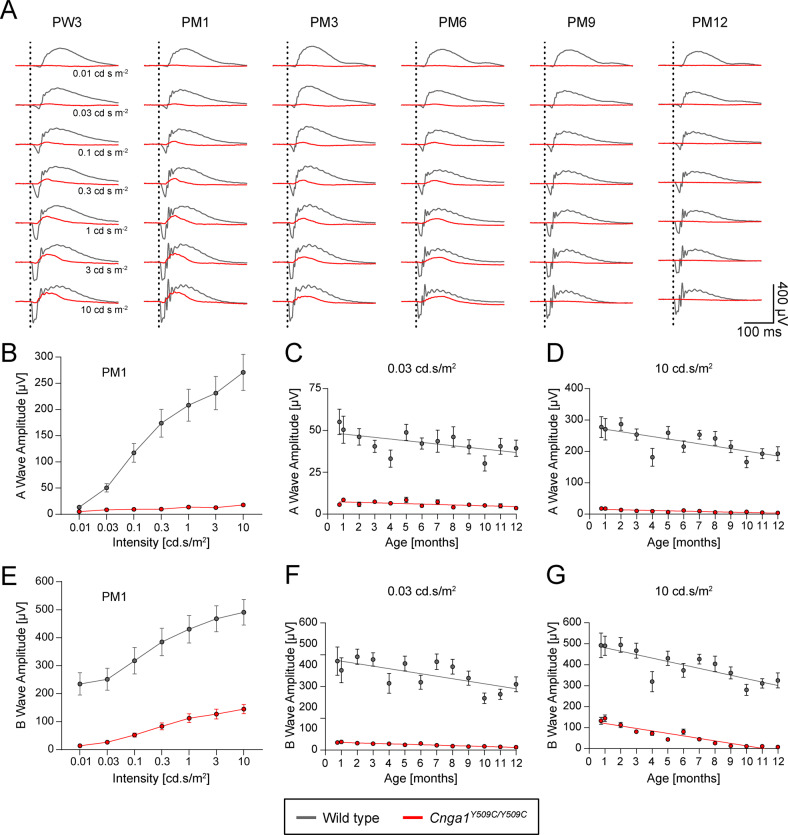
Fig. 5. Cnga1Y509C/Y509C mice show loss of rod-driven electroretinography.
A Overlays of averaged ERG signals of Cnga1Y509C/Y509C mice (red) compared to wild-type mice (black) at postnatal week 3 (PW3), postnatal month 1 (PM1), PM3, PM6, PM9 and PM12 at different light intensities. Vertical dotted lines mark the time points of light stimulation. Homozygous mutant mice show almost no (rod-mediated) response at low light intensities (0.01 and 0.03 cd s m-2) and also lose cone-mediated response between PM6 and PM9. B–G Quantification of a-wave and b-wave amplitudes of Cnga1Y509C/Y509C mice (red) compared to wild-type mice (black) at different ages. a-wave (B) and b-wave (E) amplitudes were massively reduced in Cnga1Y509C/Y509C mice compared to wild types for all light intensities at PM1. Rod-mediated responses for the a-wave (C) and b-wave (F) at a low light intensity (0.03 cd s m-2) as well as cone-mediated response for a-wave (F) at a high light intensity (10 cd s m-2) were reduced from the first measurement at PW3, while cone-mediated response for the b-wave (G) decreased over time. Wild-type mice: n = 10; Cnga1Y509C/Y509C mice: n = 12. Values are given as mean ± SEM.

