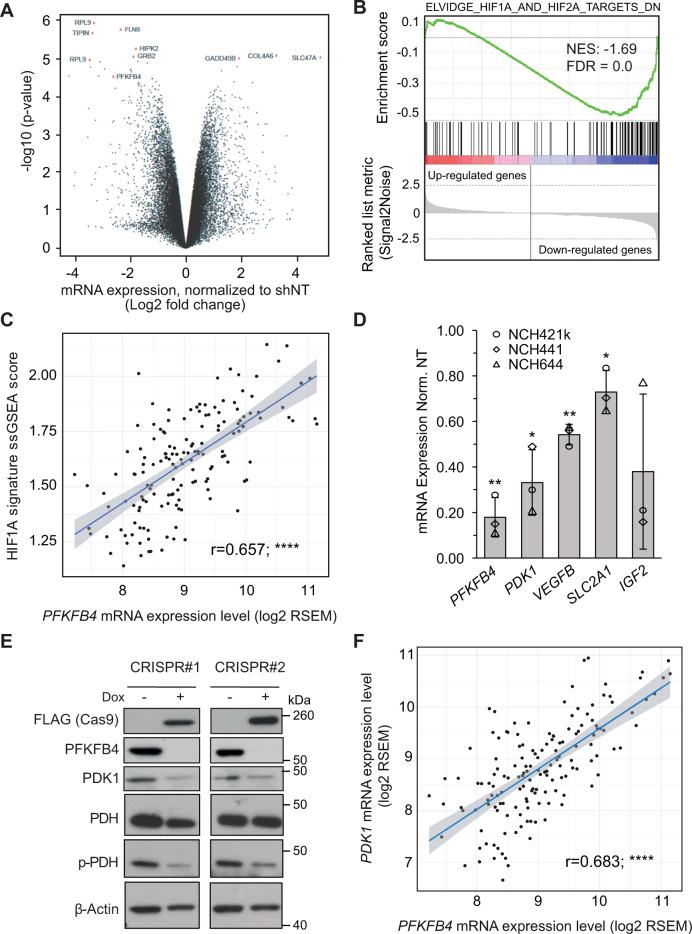
Fig. 2. PFKFB4 regulates the transcription factor HIF-1α.
A Volcano plot showing the fold changes and p-values of gene expression in PFKFB4-silenced (3 days) GSCs. Data represent mean of the three different patient-derived GSC lines: NCH421k, NCH644 and NCH441. Along with PFKFB4 itself, the top 10 deregulated probes are highlighted in red and labelled with the gene to which they map. B Gene Set Enrichment Analysis (GSEA) comparing a gene signature of downregulated genes in a HIF1A/HIF2A-silenced breast cancer cell line (from ref. [27], Elvidge) to the gene expression list of PFKFB4-silenced GSCs in a rank order based on the mean linear fold change of the genes. The green curve corresponds to the running sum of the enrichment score which reflects the degree to which the gene signature is overrepresented at the bottom of the list. (Normalized enrichment score (NES) = −1.69, false discovery rate (FDR) = 0.0). C Correlation between PFKFB4 mRNA expression and expression of the Elvidge HIF1A gene signature based on its single sample gene set enrichment analysis (ssGSEA) score in TCGA glioblastoma patients (regression analysis, r = 0.657, ****p value < 0.0001). D mRNA levels of PFKFB4 and selected downregulated HIF-1α target genes (PDK1, VEGFB, SLC2A1 and IGF2) determined by gene expression profiling in three different GSC lines. E Protein levels of FLAG (CAS9), PFKFB4, PDK1, PDH and phosphorylated PDH (S293) after doxycycline inducible knockout of PFKFB4 (7 days incubation with dox). β-actin was used as a loading control. F Correlation between PFKFB4 and PDK1 mRNA expression in TCGA glioblastoma patients (regression analysis, r = 0.683, ****p value < 0.0001).

