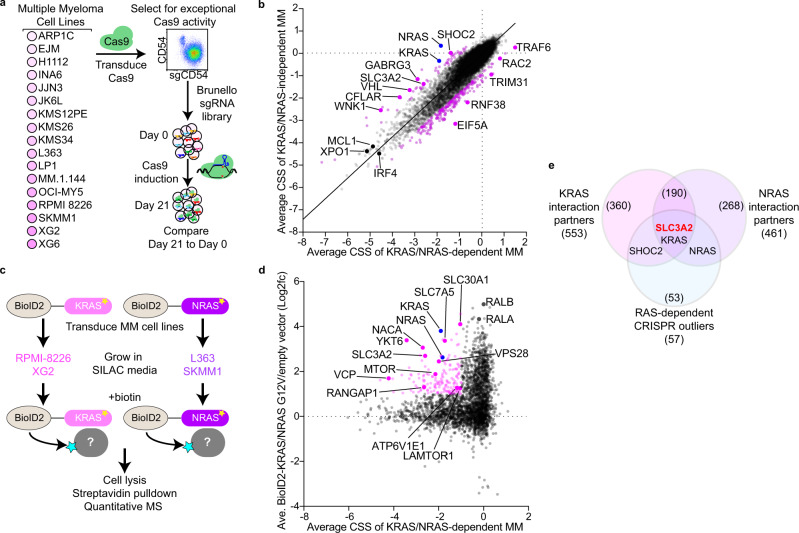
Fig. 1. Proteogenomic screens reveal a relationship between SLC3A2 and RAS in multiple myeloma.
a Workflow for CRISPR screens in MM cell lines. b Scatter plot of the average CRISPR screen scores (CSS) for RAS-dependent MM lines (x-axis) vs. RAS-independent MM lines (y-axis). Outliers were determined by an extra sum-of-squares F test (P < 0.05) and are labeled in purple and blue. c Workflow of BioID2-based mutant KRAS and NRAS proximity labeling SILAC mass spectrometry (MS) studies. d Essential interactome of G12V RAS isoforms in RAS-dependent MM. Average CSS for KRAS/NRAS-dependent MM cell lines (x-axis) plotted by average combined enrichment of BioID2-KRASG12V/ BioID2-NRASG12V relative to empty vector. Essential interactome (≤−1.0 CSS and ≥1.0 log2fc BioID2-RAS) is labeled in pink. e Venn diagram of protein interaction partners substantially enriched (≥2.0 log2fc) in BioID2-KRASG12V and BioID2-NRASG12V with RAS-dependent outlier genes identified in Fig. 1b. Source data are provided as a Source Data file.

