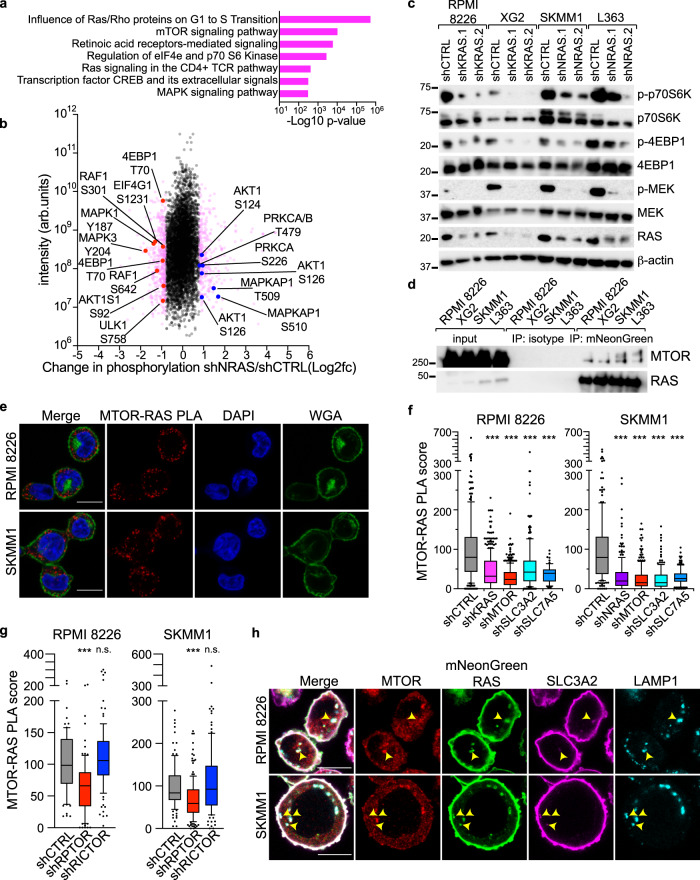
Fig. 4. RAS controls mTORC1 activity in multiple myeloma.
a Pathway analysis of proteins with ±0.8 log2 fold changes in phosphorylation in SKMM1 cells transduced with shNRAS compared to control shRNA as determined by quantitative mass spectrometry. b Scatter plot of changes in phosphorylation following NRAS knockdown (shNRAS/shCTRL; x-axis) vs. intensity (y-axis). Proteins in the MTOR and MAPK signaling pathways are labeled. c Western blot analysis of mTORC1 and MEK signaling following KRAS or NRAS knockdown in the indicated MM lines. Representative blots, n = 5. d Co-immunoprecipitation of MTOR with mutant isoforms of mNeonGreen-tagged KRAS and NRAS. KRASG12D was used in RPMI 8226 and XG2, NRASG12D in SKMM1 and NRASQ61L in L363. Representative blots; n = 3. e Proximity ligation assay (PLA) of MTOR-RAS (red) in RPMI 8226 and SKMM1 cells. Cells counterstained with DAPI (blue) and wheat germ agglutinin (WGA; green); Scale bar is 10 μm. Representative images; n = 3. f MTOR-RAS PLA score of cells transduced with control shRNA or shRNAs specific for KRAS (n = 3), NRAS (n = 3), SLC3A2 (n = 3), SLC7A5 (n = 2) and MTOR (n = 3). Data pooled from independent experiments; the number of cells quantified per condition listed in the source data file. *** denotes P value <0.0001 by one-way ANOVA with Dunnett’s post test. Box plots represent median and 25–75% of data, whiskers incorporate 10–90% of data, outliers are displayed as dots. g MTOR-RAS PLA in RPMI 8226 and SKMM1 cells expressing shCTRL (n = 3), shRPTOR (n = 3) or shRICTOR (n = 3) shRNAs. Data pooled from independent experiments; the number of cells quantified per condition listed in the source data file. *** denotes P value <0.0001, n.s. denotes not significant, by one-way ANOVA with Dunnett’s post test. Box plots represent median and 25–75% of data, whiskers incorporate 10–90% of data, outliers are displayed as dots. h Immunofluorescence of MTOR (red), ectopically expressed mNeonGreen-KRASG12D in RPMI 8226 or mNeonGreen-NRASG12D SKMM1 cells (green), SLC3A2 (magenta) and LAMP1 (cyan). Yellow arrows highlight areas of overlap. Scale bar is 10 μm. Representative images; n = 3. Source data are provided as a Source Data file.

