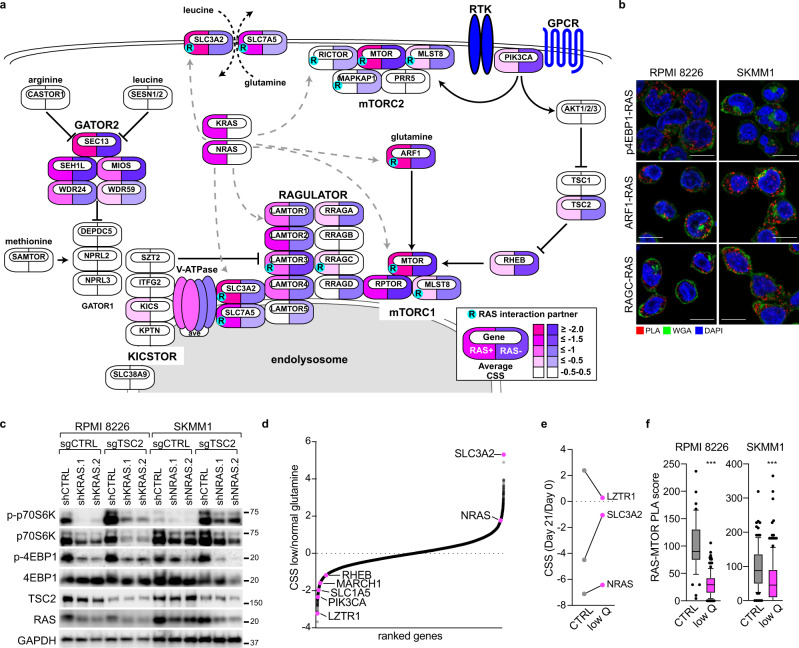
Fig. 5. Oncogenic RAS activates mTORC1 by co-opting the amino acid sensing machinery.
a Pathway diagram of MTOR signaling. Symbols are colored by the average CRISPR screen score (CSS) in RAS-dependent (pink) and RAS-independent (purple) MM cell lines and marked with a cyan dot containing an “R” if they were found to interact with mutant KRAS and NRAS in BioID2 experiments (≥2.0 log2fc). b Indicated proximity ligation assays (PLA) in RPMI 8226 and SKMM1 cells with PLA (red), wheat germ agglutinin (WGA; green) and DAPI (blue). Scale bar is 10 μm. Representative images; n = 2. c Western blot analysis of mTORC1 signaling in RPMI 8226 and SKMM1 cells following KRAS or NRAS knockdown and expression of either control (sgCTRL) or TSC2 sgRNAs. Representative blots; n = 3. d CRISPR modifier screen results identify genes with differential essentialities under glutamine restriction vs. normal glutamine conditions in SKMM1. CSS of genes from cells grown under glutamine restriction vs. normal glutamine conditions on y-axis. e Change in CSS for LZTR1, SLC3A2 and NRAS from Day 21 vs. Day 0 for normal glutamine conditions (gray) and under glutamine restriction (pink). f MTOR-RAS Proximity ligation assay (PLA) scores for cells under normal glutamine conditions (gray; n = 3) and under acute (12 h) glutamine restriction (pink; n = 3). Data pooled from independent experiments; the number of cells quantified per condition indicated in the source data file. *** denotes P value <0.0001 determined by Mann–Whitney unpaired two-tailed t-test. Box plots represent median and 25–75% of data, whiskers incorporate 10–90% of data, outliers are displayed as dots. Source data are provided as a Source Data file.

