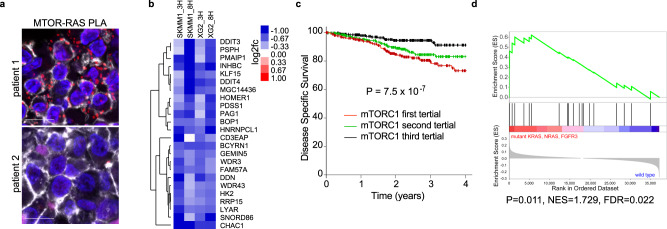
Fig. 6. RAS-dependent mTORC1 activity in primary multiple myeloma.
a Proximity ligation assay (PLA) between MTOR and RAS in formalin-fixed paraffin-embedded (FFPE) bone marrow aspirates from MM patients with PLA (red), CD138 (white) and DAPI (blue). Scale bar is 10 μm. b Changes in expression for the mTORC1 signature genes following treatment with 100 nM everolimus for the indicated cell lines and times. c Kaplan–Meier survival plots of MM patients from the MMRF CoMMpass trial divided into tertials by gene expression of the mTORC1 down signature in panel (b). The P value was determined using a two-sided likelihood-ratio test based on a Cox proportional hazard model with the mTORC1 signature treated as a continuous variable. d Gene Set Enrichment Analysis (GSEA) of mTORC1 signature for KRAS, NRAS and FGFR3 mutations in the MMRF CoMMpass patient cohort. Source data are provided as a Source Data file.

