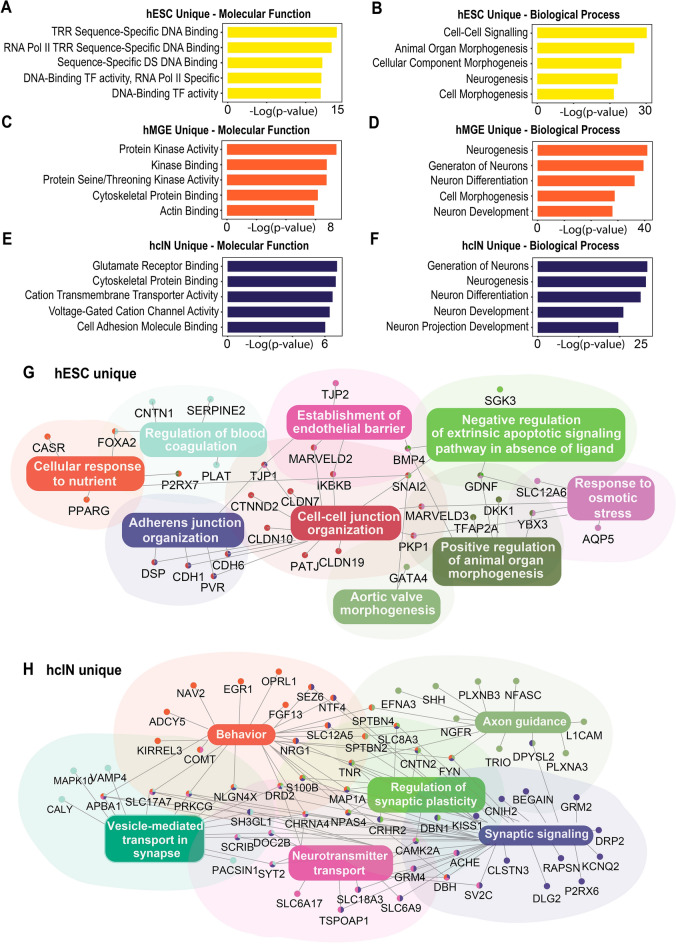
Figure 2.
Analysis of genes associated with CHD2 binding during hcIN differentiation. (A–F) Gene ontology (GO) enrichment analysis of genes with a promoter proximal CHD2 peak uniquely in (A, B) hESCs, (C, D) hMGEs, or (E, F) hcINs. − Log10 p values for top enriched terms are shown. (G, H) Gene networks generated from a single representative GO term. In (G), the hESC ‘unique’ CHD2-bound gene network was generated by focusing on intracellular junction-related genes. In (H), the hcIN ‘unique’ CHD2-bound gene network was generated by focusing on synapse-related genes.

