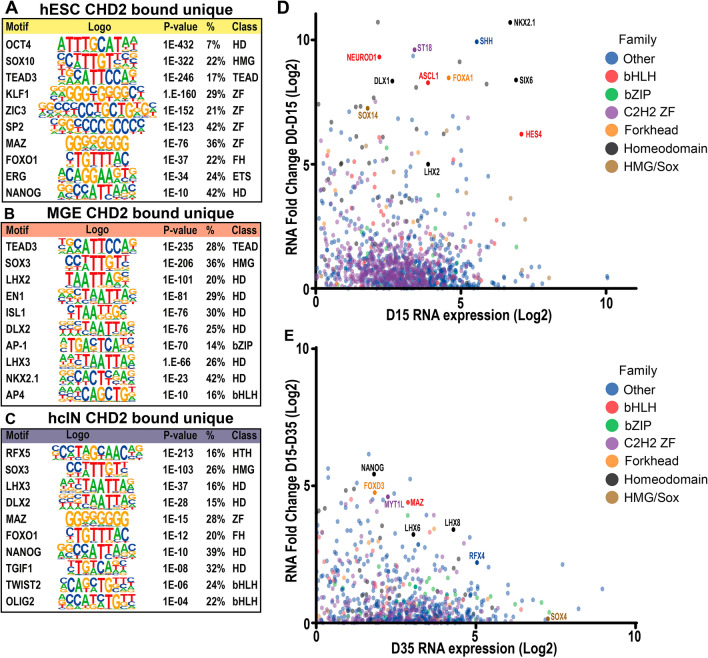
Figure 3.
Analysis of candidate TFs that may co-bind the genome with CHD2 during hcIN differentiation. (A–C) Predicted transcription factor (TF) binding motifs under CHD2 peaks unique to (A) hESCs, (B) hMGEs and (C) hcINs. Adjusted p-values, the percentage of peaks with each TFBS, and the TF class are shown (HD = homeodomain, ZF = Zinc finger, FH = forkhead). (D) Expression changes of up-regulated TFs from hESC (D0) to hMGE (D15). Only TFs with a RPKM value greater than 1 (i.e. log2 RPKM > 0) and a positive fold change from D0 to D15 (i.e. log2 FC > 0) are shown. (E) Expression changes of up-regulated TFs from hMGE (D15) to hcIN (D35). Only TFs with a RPKM value greater than 1 (i.e. log2 RPKM > 0) and a positive fold change from D15 to D35 (i.e. log2 FC > 0) are shown.

