Figure 4.
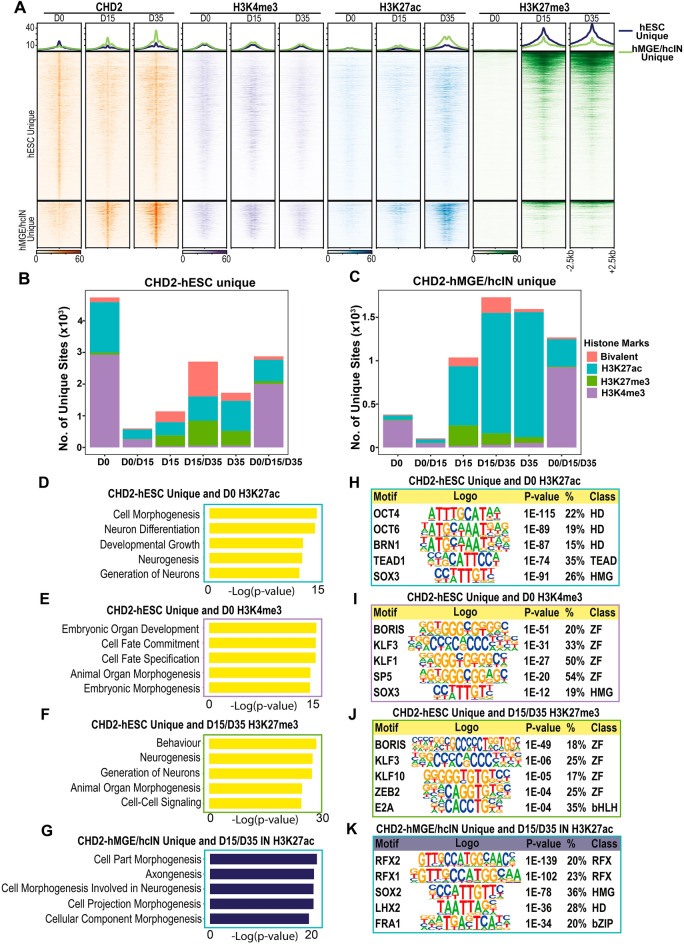
Histone modification states associated with CHD2 binding during hcIN differentiation. (A) Signal enrichment of H3K4me3, H3K27ac, and H3K27me3 modification around CHD2 bound peaks in hESCs, hMGEs, and hcINs. Line plots at top: averaged signal for CHD2 binding and histone modification in the hESC unique CHD2 peak cluster (upper panels) and the hMGE/hcIN unique peak cluster (lower panels), respectively. (B, C) Coenrichment of histone modifications with CHD2 bound peaks. For CHD2-bound peaks that were (B) unique to hESCs or (C) unique to hMGEs and/or hcINs but not hESCs, the number of unique overlapping peaks for each histone modification at the time indicated in days (D) is shown. Bivalent status was defined by the intersection between H3K4me3 and H3K27me3 peaks. (D–F) Gene ontology (GO) enrichment analysis of genes associated with CHD2 peaks unique to hESCs and enriched for (D) H3K27ac at D0, (E) H3K4me3 at D0, or (F) H3K27me3 at either/or D15 or D35. (G) Gene ontology (GO) enrichment analysis of genes with a CHD2 peak in hMGEs and/or hcINs and associated with H3K27ac at either/or D15 or D35, with p-values for top terms (expressed as -log10) shown. (H–J) Transcription factor binding site enrichment under CHD2 peaks unique to hESCs and enriched for (H) H3K27ac at D0, (I) H3K4me3 at D0, or (J) H3K27me3 at either/or D15 or D35. (K) Transcription factor binding site enrichment under CHD2 peaks in hMGEs and/or hcINs that were coenriched for H3K27ac at either/or D15 or D35.

