Figure 5.
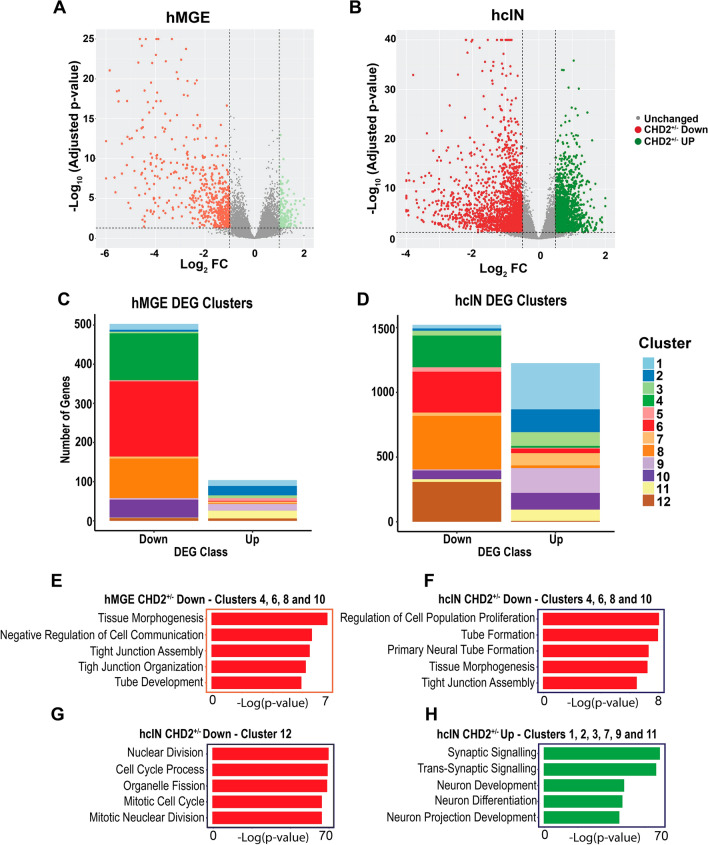
Gene expression changes in hMGEs and hcINs with CHD2 haploinsufficiency. (A, B) Gene expression differences (log2 FC) between wild type (WT) and mutant (CHD2+/−) in (A) hMGEs and (B) hcINs. Red: down-regulated genes in the mutant (CHD2+/−); green: up-regulated genes in the mutant (CHD2+/−). (C, D) Distribution across the 12 previously identified WT gene expression clusters for differentially expressed genes (DEGs) obtained in WT versus CHD2+/− comparisons at the (C) hMGE and (D) hcIN stage. (E–G) Gene ontology (GO) enrichment analysis of DEGs down regulated in CHD2+/− compared to WT models at the (E) hMGE or (F, G) hcIN stage. For hcINs, DEGs that mapped to WT expression (F) clusters 4, 6, 8 and 10, versus (G) cluster 12 were analyzed separately. (H) Gene ontology (GO) term analysis of DEGs that were upregulated in the CHD2+/− compared to the WT model at the hcIN stage.

