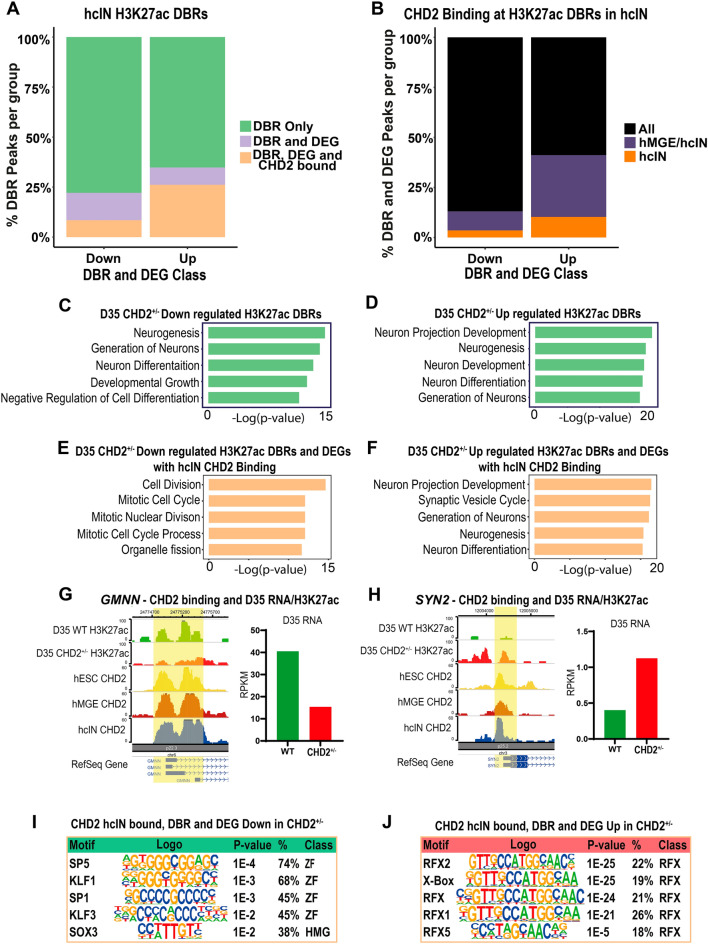
Figure 7.
Corresponding epigenetic changes and differential gene expression resulting from CHD2 haploinsufficiency in hcINs. (A) Intersection of H3K27ac differentially bound regions (DBRs) and DEGs in the WT versus CHD2+/− comparisons, and of CHD2 binding events in hcINs. DBRs and DEGs were required to change in the same direction in CHD2+/− versus WT hcINs. (B) Temporal kinetics of CHD2 binding at H3K27ac DBRs associated with a DEG. The relative frequency with which DBR and DEG associated peaks were bound by CHD2 throughout differentiation (“All”) was compared was compared with the fraction of DBR- and DEG-associated peaks bound by CHD2 only at later stages of development (either at both the hMGE and hcIN stages or uniquely in hcINs). (C, D) Gene ontology (GO) enrichment analysis of DEGs associated with H3K27ac DBRs that were (C) down-regulated or (D) up-regulated in CHD2+/− hcINs, by comparison with WT. Top GO terms and their -log10 p-values are shown. (E, F) Gene ontology (GO) term analysis of DEGs associated with H3K27ac DBRs that were also CHD2 bound in hcINs, where the DEGs and DBRs were either (E) down-regulated or (F) up-regulated in the CHD2+/− versus WT hcINs. (G, H) Examples of H3K27ac DBRs that were associated with DEGs and with CHD2 binding in hcINs were obtained from analysis of genes associated with significant GO terms and include (G) GMMN (down-regulated DBR and DEG in the CHD2+/− vs. WT comparison) or (H) SYN5 (up-regulated DBR and DEG in the CHD2+/− vs. WT comparison). (I, J) Analysis of enriched transcription factor binding sites under DBRs that are also CHD2 bound peaks and are associated with DEGs in hcINs, with analysis considering either sequences under peaks that were (I) down-regulated or (J) up-regulated DBRs and DEGs in CHD2+/− versus WT hcINs.

