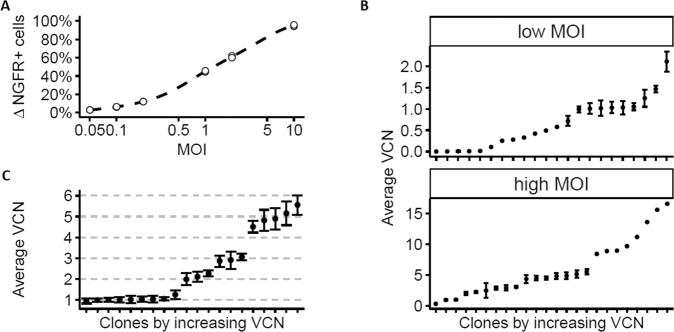
Fig. 2. Cell transduction efficiency and clone screening.
A Expression of the transgene was measured by flow cytometry 4 days after transduction performed in duplicate, showing that the proportion of transduced cells increases accordingly to the MOI. Dots show the result of each duplicated transduction. B Measure of VCN by qPCR PSI-ALB, in all the clones obtained from the pool of low vector dose (MOI 0.05–0.5) ranging up to VCN = 2.0 (top panel) or high vector dose (MOI 1–10) (ranging up to VCN = 17). Data represent means with error bars denoting mean 95% confidence intervals with 5 to 20 independent qPCR runs per clone. C Measure of VCN by qPCR PSI-ALB in a selection of clones with 1 to 6 VCN which were selected and further characterized. Data represent means with error bars denoting mean 95% confidence intervals with 5 to 20 independent qPCR runs per clone.

