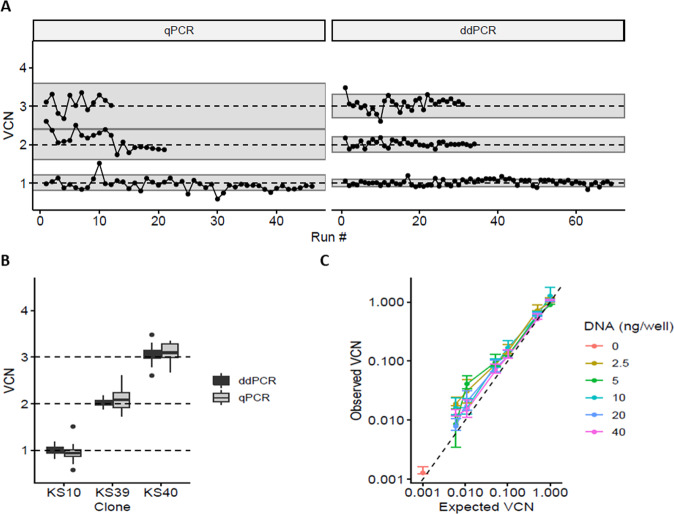
Fig. 3. Comparison of VCN quantification methods on three selected reference clones.
Clones KS10, KS39 and KS40 with 1, 2 or 3 VCN respectively, were extensively tested for VCN over time using either qPCR or ddPCR. A Longitudinal quantification of VCN with both methods over a period of 4 years indicated by the different tests (runs) and corresponding to more than 60 independent runs for clone KS10 (1 copy) and up to 9 gDNA batches tested. Batch-to-batch variation was limited (≤6%). Gray ribbons represent a target variation of 20% (qPCR) or 10% (ddPCR) around the expected VCN values. B The aggregation of all VCN obtained in A show that ddPCR is twice more accurate than qPCR with a coefficient of variation (CV) between 3 and 8%. C Clone KS10 with a single integrated provirus was used to challenge the ddPCR sensitivity using decreasing amount of gDNA (2.5 to 40 ng per well) and decreasing VCN by mixing with gDNA of untransduced cells down to 0.005 VCN. Each combination of DNA quantity/VCN was tested independently 4 times. Data represent mean ± standard error of the mean (sem). For a log/log representation of data, 0.001 was added to all values.

