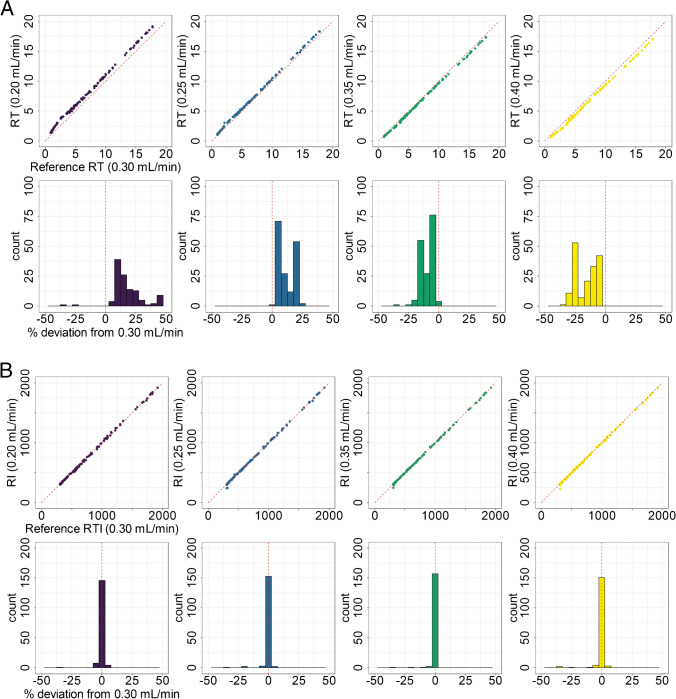
Fig. 2.
A Comparison of RTs between the reference method (0.30 mL/min) and other flow rates tested. For this comparison, all chromatographic parameters were kept constant, except for the flow rate. Systematic deviations of RTs under different flowrates compared to standard condition (0.30 mL/min) were observed. The upper row of plots shows the scatter plot of the RTs from each different flow rates plotted against the reference condition. The red dashed line indicates the diagonal, which represents a perfect fit. The lower row shows histograms of the relative deviation of RTs from the reference method in %. Flow rates lower than the reference flow rate showed higher RTs, while higher flow rates lead to decreased RTs. B Plots are similar to A, except that RI is used instead of RT. Good agreement between RIs from all conditions is found. All plots indicate that the conversion of RT to RI enables the normalization of the different flow rates

