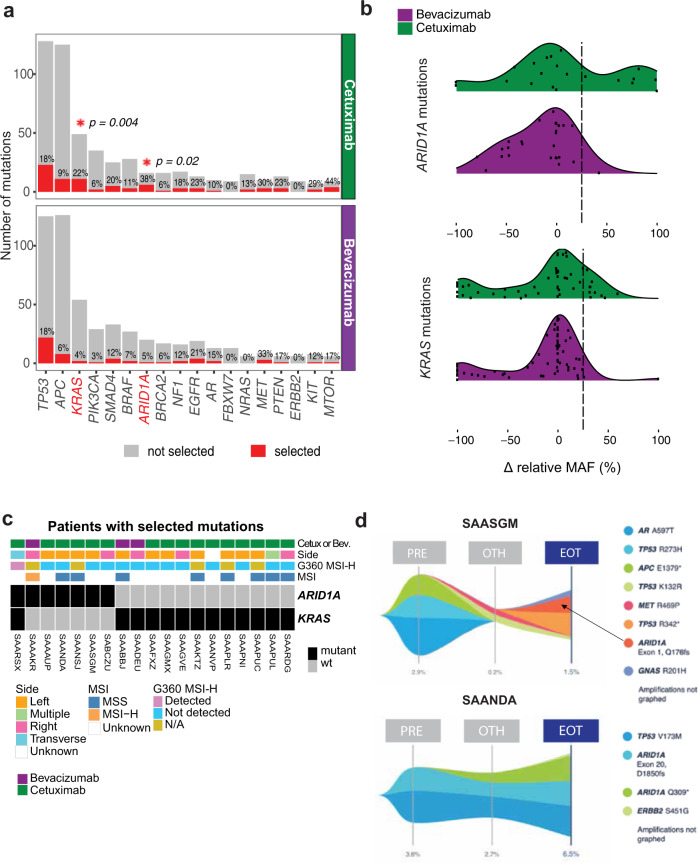
Fig. 1. ARID1A and KRAS mutations are enriched in patients treated with cetuximab.
a Number of patients with genomic alterations at either timepoint per treatment arm. Genomic alterations include non-synonymous single-nucleotide variants (SNV), indels, and gene rearrangements. Layered above the red bar is the corresponding percentage of patients with selected alterations, defined as an increase by 25 percentage points in the normalized MAF, calculated relative the highest reported MAF, between paired baseline and end of study cfDNA from 333 1L mCRC patients treated with either bevacizumab or cetuximab in combination with chemotherapy in the CALGB/SWOG 80405 trial. Asterisks indicate statistically significant differences (FDR p-value < 0.2) by two-tailed Fisher’s exact test, restricted to 18 genes with at least 2 selected alterations in either arm. b Distribution of the % change in relative MAF between baseline and end of study for all KRAS and ARID1A alterations detected in all patients. Dashed line represents 25% threshold used to call tumors with selected mutations. c Clinical information for patients with selected ARID1A and/or KRAS alterations. d Representative mutation evolution maps for cetuximab-treated patients with selected ARID1A mutations. The maximum observed % MAF is shown at the bottom for each timepoint. PRE, at baseline; OTH, on treatment; EOT, at progression or end of study.

