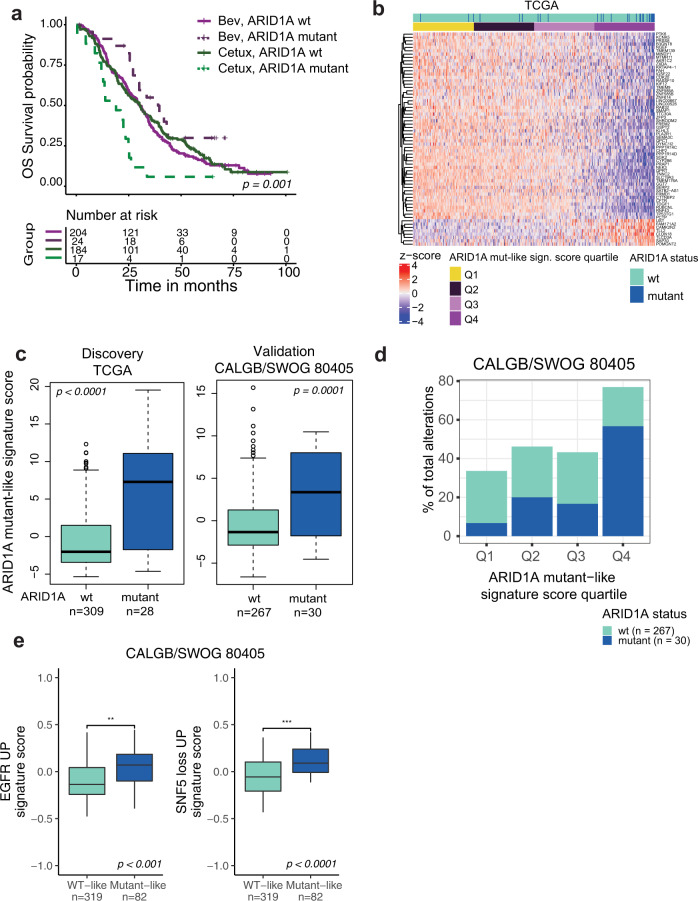
Fig. 2. ARID1A mutations confer poor outcome to cetuximab relative to bevacizumab possibly by partially inducing an EGFR transcriptional program.
a Kaplan–Meier curves showing OS for 429 CALGB/SWOG 80405 patients with archival tissue available for targeted sequencing24, stratified by ARID1A mutation status and treatment arm. Patients with ARID1A alterations classified as known or likely were considered mutant. p-values from log-rank test shown. b Heatmap representation of the ARID1A mutant-like signature in 578 CALGB/SWOG 80405 patients with gene expression data. c Distribution of the ARID1A signature score in the discovery TCGA cohort and validation cohort CALGB/SWOG 80405 cohort stratified by ARID1A mutation status. p-values determined by two-sided Wilcoxon rank sum test. d ARID1A mutant-like signature score split into quartiles with the % of alterations in each quartile that were ARID1A mutant and WT in the 297 patients with both RNAseq and FMI mutation data available from the CALGB/SWOG 80405 cohort. e Distribution of MSigDB C6 Oncogenic signatures (GSVA scores) by ARID1A mutant-like signature group in CALGB/SWOG 80405. Two-sided Wilcoxon rank sum test; *p < 0.05, ***, p < 0.001. c, e The interquartile range (IQR) is depicted by the box with the median represented by the center line. Whiskers maximally extend to 1.5× IQR (with outliers shown). Source data are provided as a Source Data file.

