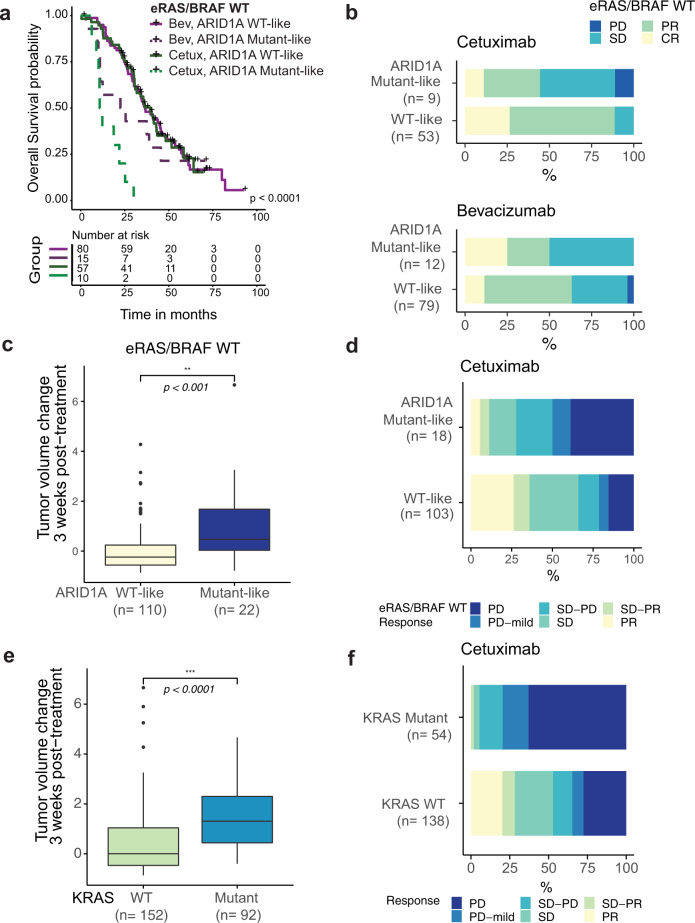
Fig. 3. ARID1A mutant-like signature enriches for cetuximab-resistant patients in eRAS/BRAF WT tumors.
a Kaplan–Meier curves showing OS in n = 162 eRAS/BRAF WT patients stratified by ARID1A signature group (mutant-like vs. WT-like), using the signature score Q4 cutoff, and by treatment arm with p-values from log-rank test shown. b Clinical response (best RECIST) to cetuximab (top) and bevacizumab (bottom) was stratified by ARID1A mutant-like signature group for the n = 153 CALGB/SWOG 80405 eRAS/BRAF WT patients with RECIST response, RNAseq and FMI alterations data available. PD, progressive disease; SD, stable disease; PR, partial response; CR, complete response. CR and PR cases were considered responders and SD and PD cases non-responders to treatment. a, b Source data are provided as a Source Data file. c, e Change in tumor volume from baseline to after 3 weeks on cetuximab treatment (20 mg/kg, twice a week) for 132 eRAS/BRAF WT PDX models shown by ARID1A signature group (c), and for all 244 PDX models shown by KRAS mutation status (e). p-values by two-sided Wilcoxon rank sum test (***p < 0.001). The interquartile range (IQR) is depicted by the box with the median represented by the center line. Whiskers maximally extend to 1.5× IQR (with outliers shown). d, f Cetuximab response by ARID1A signature group in the eRAS/BRAF WT population (d; n = 121) and by KRAS status in the full PDX cohort (f; n = 192).

