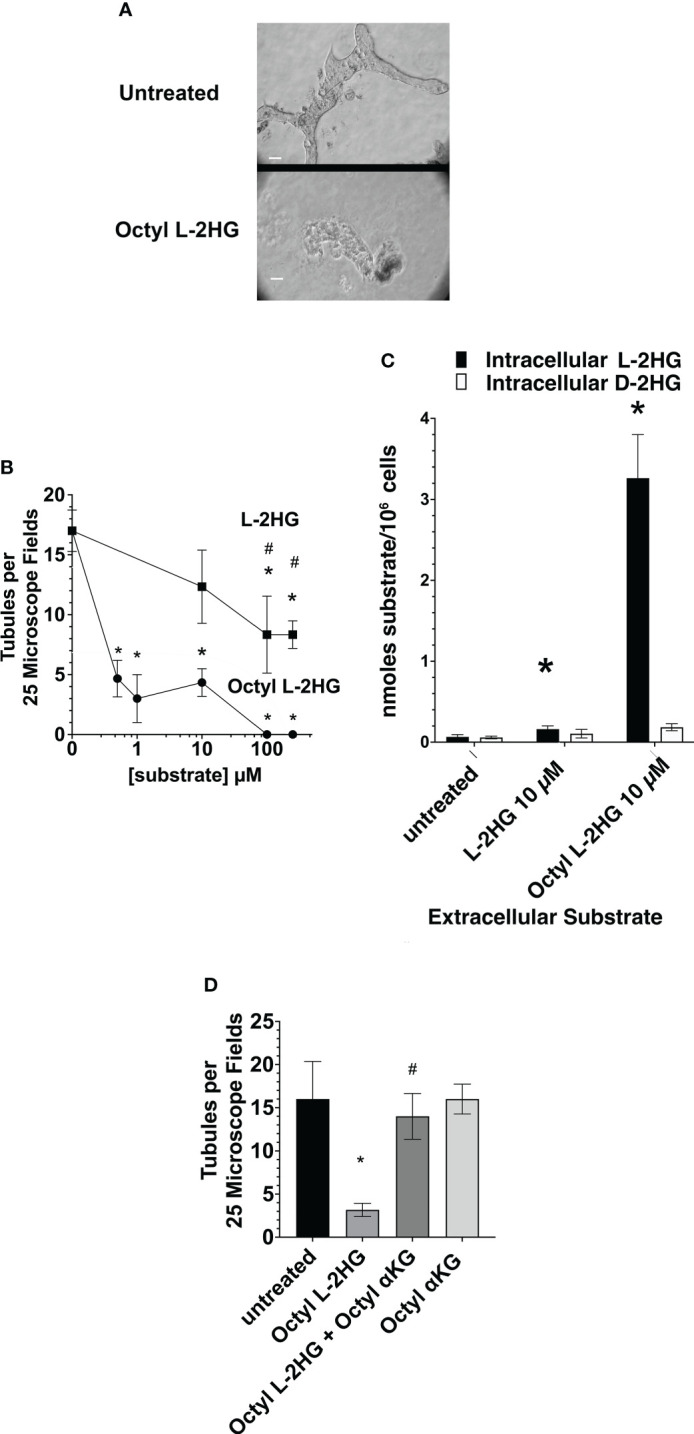
Figure 3.

Inhibition of tubulogenesis by Octyl L-2HG. (A) Representative microscope fields of either control matrigel cultures in DMEM/F12-IT supplemented with 5 ng/ml EGF alone, or further supplemented with 100 µM Octyl L-2HG. (B) The frequency of tubule formation as a function of the concentration of either Octyl L-2HG or L-2HG. (C) Effect of 10 µM L-2HG or Octyl L-2HG on the intracellular L- and D-2HG concentration. (D) Effect of 5-octyl-αKG (250 µM) on the Octyl L-2HG (100 µM)-induced inhibition of tubulogenesis. Values are averages +/- SEM of triplicate determinations. (*) p < 0.05 relative to untreated cultures; (#) p < 0.05 relative to Octyl L2HG. Scale Bar, 50 µm.
