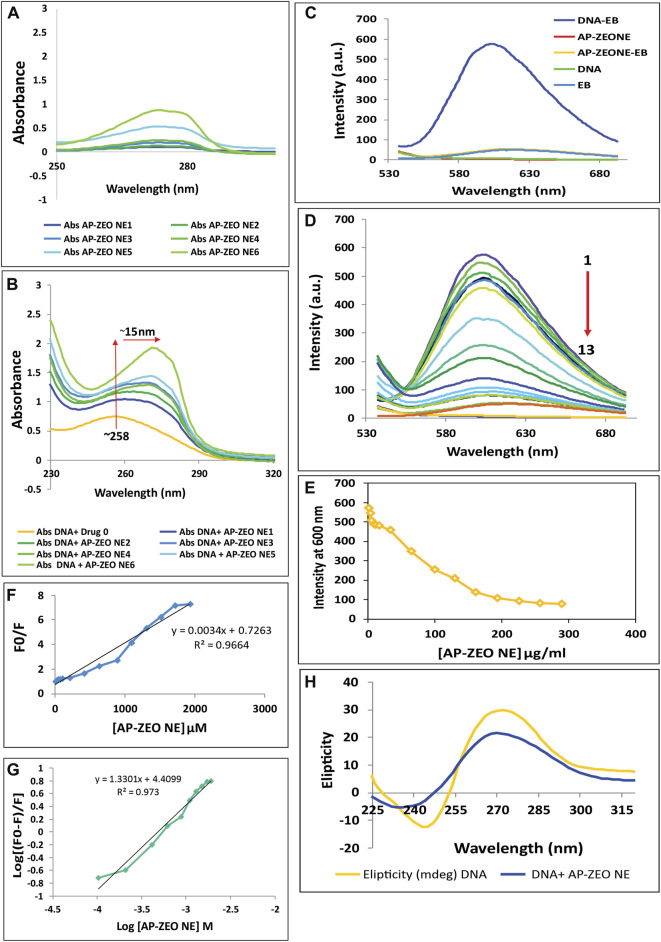
FIGURE 5.
Interaction of AP-ZEONE with RH-DNA (A) UV–visible spectra of AP-ZEONE alone (B) and AP-ZEONE-DNA complex in the presence of AP-ZEONE (0–32 μg/ml). Hyperchromism with a 15 nm shift was observed with an increasing concentration of AP-ZEONE confirming the interaction of AP-ZEONE and DNA (C) Fluorescence spectra of DNA, EB, AP-ZEONE, AP-ZEONE-EB, and DNA-EB. (D–E) Competitive displacement assays of DNA-EB in the presence of AP-ZEONE (0–192 μg/ml). The arrow shows the decrease in the fluorescence intensity upon increasing the concentration of AP-ZEONE (F) Fluorescence quenching Stern–Volmer plot of DNA-EB and (G) Modified Stern–Volmer plot for the quenching of DNA-EB with increasing concentration AP-ZEONE (H) The CD spectra of DNA (100 μg/ml) in the presence of an 8 μg/ml concentration of AP-ZEONE.

