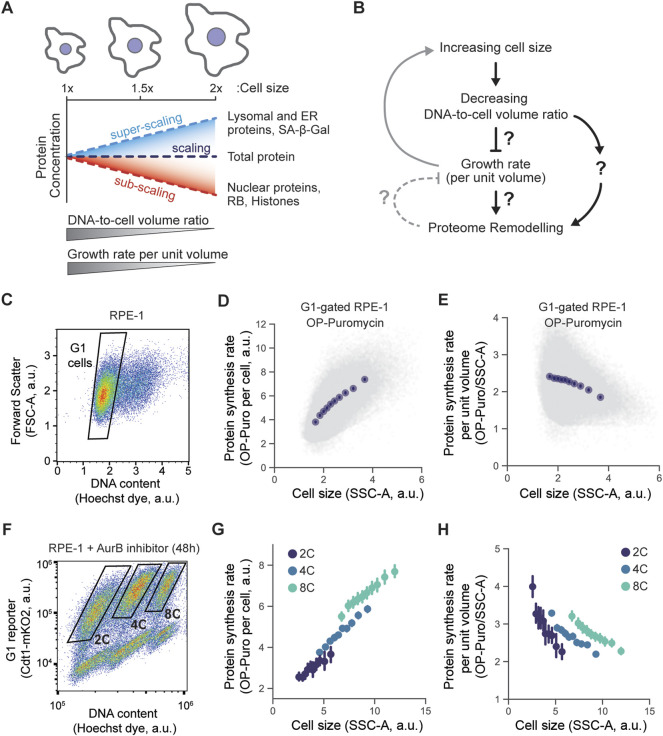
FIGURE 1.
The relationship between cell size and growth rate. (A,B) Schematics depicting the phenotypes associated with increasing cell size. Increase in cell size leads to the decrease in DNA to cell volume ratio and reduction of cell growth rate per unit volume. Changes in cell size are also accompanied by global proteome remodeling, i.e., some proteins are concentrated while others are diluted as cells grow larger. (C-E) Protein synthesis rate measured using OP-puromycin incorporation. After 30 min labeling, OP-puromycin was click-conjugated to a fluorescent azide and measured using flow cytometry. RPE-1 cells were gated for G1 DNA content (C), and the incorporated OP-puromycin amount, which reflects the nascent protein synthesis rate, was plotted against the Side Scatter (SSC-A), a proxy for cell size (D). To represent the synthesis rate per unit volume, the conjugated OP-puromycin fluorescence intensity was divided by the cell volume proxy SSC-A and plotted against the SSC-A (E). (F-H) Same experiment performed in (C–E) but measuring the protein synthesis rates in populations of RPE-1 cells with different ploidies. To generate tetraploid and octoploid cells, the cytokinesis was partially inhibited in RPE-1 cells using the Aurora kinase B inhibitor barasertib (100 nM, 48 h) (Mu et al., 2020; Lanz et al., 2022), then 2C, 4C, and 8C were then gated using flow cytometry (F). The overall protein synthesis rate (G) and the protein synthesis rate per unit volume (H) were plotted against the SSC-A, a proxy for cell volume. Each experiment was performed in n = 3 biological replicates, and a representative example for each experiment is shown in this Figure. Data in plots (D), (E), (G), and (H) were binned by cell size (SSC-A), and means ±95% confidence intervals were plotted for each bin.

