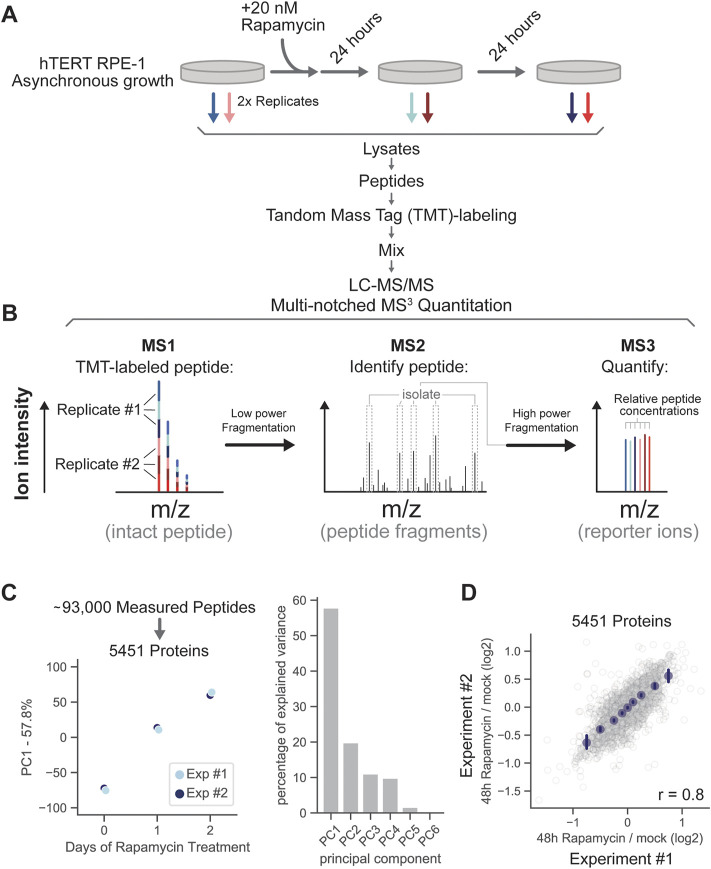
FIGURE 2.
Proteome remodeling in response to mTOR inhibition. (A) Asynchronously growing RPE-1 cells were treated with 20 nM rapamycin for 24 and 48 h and subjected to multiplexed proteomic analysis. (B) Diagram outlining TMT-labeled peptide quantitation via multi-notched MS3 mass spectrometry. Peptides labeled with tandem mass tags (TMT) are fragmented with low collisional energy between MS-level 1 and 2 to break peptide bonds. The fragmentation steps are depicted by the two horizontal arrows. Prominent fragment ions in the MS2 spectra are then collected and fragmented with high energy to release the TMT reporter ions (MS3), which are then used to quantify changes in peptide concentration. (C) Principal component analysis of the relative changes in protein concentration after 0, 24, and 48 h of rapamycin treatment. (D) Correlation of relative protein concentration changes in replicate experiments (48 h of rapamycin treatment/0 h of rapamycin treatment). Binned average values are shown in navy blue dots and the error bars represent 99% confidence intervals. Pearson’s r value is displayed on the bottom right of the figure panel. Measurements for each individual protein can be found in Supplementary Table S1.

