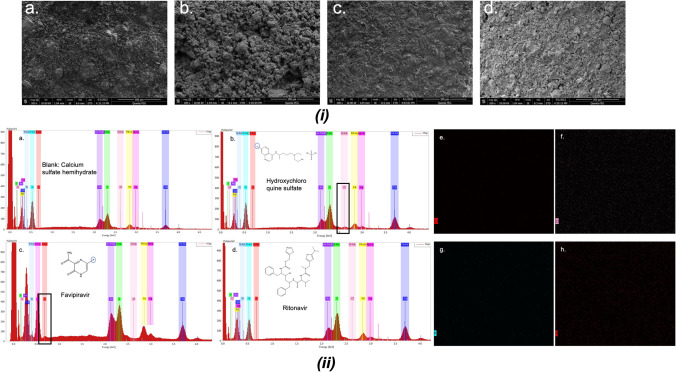
Fig. 5.
(i) Scanning electron microscope (SEM) images of the printed a., calcium sulfate hemihydrate (blank); b., hydroxychloroquine sulfate; c., favipiravir; d., ritonavir tablets; (ii) Energy-dispersive x-ray (EDX) spectroscopy and element analysis chart. a., calcium sulfate hemihydrate (blank); b., hydroxychloroquine sulfate; c., favipiravir; d., ritonavir tablets. Element Au, Pd and Ag were from vacuum sputtering. Element distribution images: Cl surface distribution of blank (e) and hydroxychloroquine sulfate (f); F surface distribution of blank (g) and favipiravir (h).

