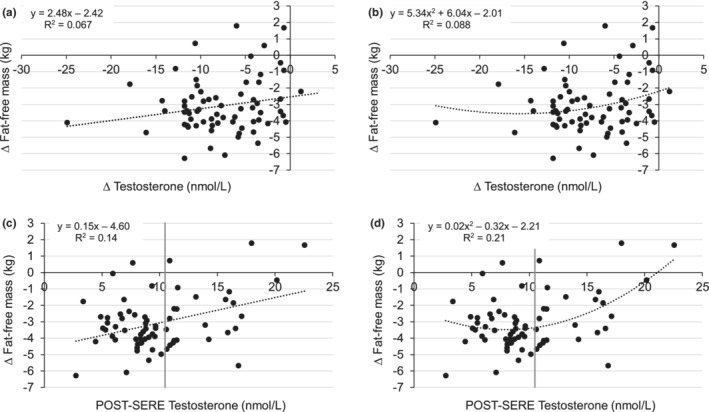
FIGURE 2.

Linear (a) and second‐degree polynomial (b) regression analysis of change in fat‐free mass with change in testosterone concentrations (R 2 = 0.067, p = 0.034 and R 2 = 0.088, p = 0.053, respectively). Non‐transformed data are presented for easier visual interpretation, but the statistics are derived from regression analyses using non‐transformed change in fat‐free mass and log transformed change in testosterone concentrations. Linear (c) and second‐degree polynomial (d) regression analysis of change in fat‐free mass with POST testosterone concentrations (R 2 = 0.14, p = 0.0017 and R 2 = 0.21, p = 0.0005, respectively). The vertical gray line represents the lower end of the harmonized reference range for normal total testosterone concentrations (10.5 nmol/L; 5th percentile) in healthy, normal weight males 19–39 y (Travison et al., 2017).
