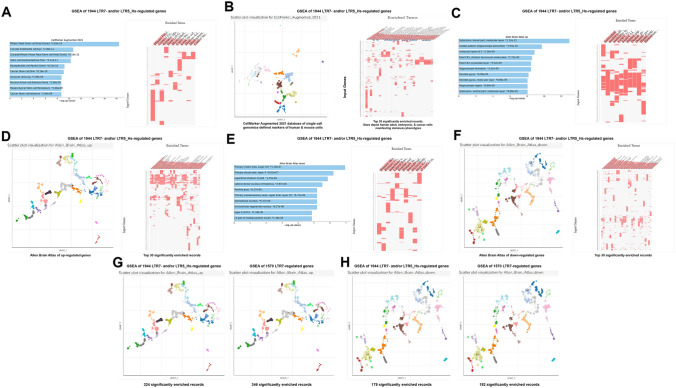
Fig. 12.
Potential phenotypic impacts of LTR7 and LTR5_Hs elements revealed by GSEA of 1944 high-fidelity down-steam target genes employing the Cell Marker Augmented 2021 database (A; B), the Allan Brain Atlas databases of up-regulated genes (C; D; G) and down-regulated genes (E; F; H). Left panel in B shows scatterplot visualization of GSEA results of the Cell Marker Augmented 2021 database of single-cell genomics-defined markers of human cells. Right panel in B reports top 30 significantly enriched records of gene sets identified by the GSEA of the Cell Marker Augmented 2021 database highlighting by stars gene expression signatures of human adult, embryonic, and cancer cells manifesting stemness phenotypes. Left panel in D shows scatterplot visualization of GSEA results of the Allan Brain Atlas database of up-regulated genes. Right panel in D reports top 30 significantly enriched records of gene sets identified by the Allan Brain Atlas database of up-regulated genes. Left panel in F shows scatterplot visualization of GSEA results of the Allan Brain Atlas database of down-regulated genes. Right panel in F reports top 30 significantly enriched records of gene sets identified by the Allan Brain Atlas database of down-regulated genes. Figure G shows side-by-side aligned scatterplots’ visualization of GSEA results of the 1944 LTR7- and/or LTR5_Hs-regulated genes (left panel; 324 significantly enriched records) and 1570 LTR7-regulated genes (right panel; 346 significantly enriched records) employing the Allan Brain Atlas database of up-regulated genes. Figure H shows side-by-side aligned scatterplots’ visualization of GSEA results of the 1944 LTR7- and/or LTR5_Hs-regulated genes (left panel; 178 significantly enriched records) and 1570 LTR7-regulated genes (right panel; 192 significantly enriched records) employing the Allan Brain Atlas database of down-regulated genes. In panels A, C, and E, results illustrating the top 10 significantly enriched records are reported. All reported significantly enriched records were identified at the significance threshold of adjusted p value < 0.05 by the GSEA of genes regulated by LTR7- and/or LTR5_Hs loci employing the corresponding genomic databases (Methods)

