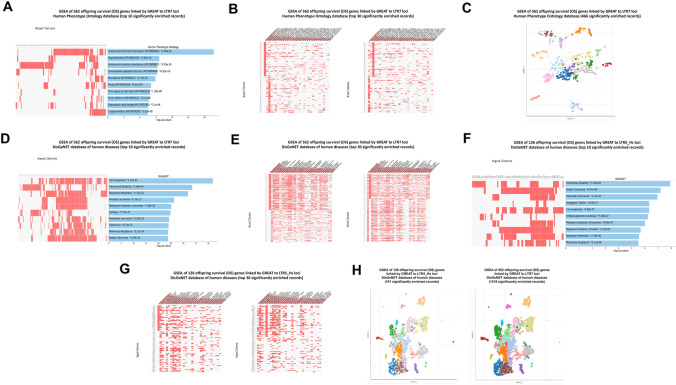
Fig. 6.
Analysis of phenotypic impacts of LTR7—and LTR5_Hs—linked mammalian offspring survival (OS) genes revealed by GSEA of the Human Phenotype Ontology database (A–C) and the DisGeNET database of human diseases (D–H). In figures (B; G; and C) input genes are sorted by different phenotypic traits in the left and right panels to demonstrate the overlapping patterns of genes associated with different phenotypic traits. The scatterplots in (C) and (H) are organized so that similar gene sets are clustered together. Larger, darker, black-outlined points represent significantly enriched terms. Clusters are computed using the Leiden algorithm. Points are plotted on the first two UMAP dimensions. In web-based software Enrichr settings, hovering over points will display the associated gene set name and the p value. Reader may have to zoom in using the toolbar next to the plot to see details in densely populated clusters. Plots can also be downloaded as a svg using the save function on the toolbar

