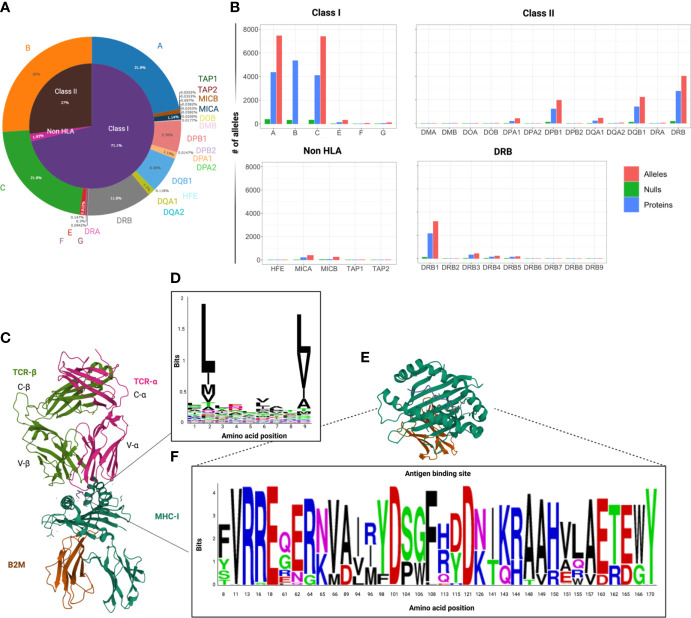
Figure 1.
Variability of HLA locus. (A) Circle graph capturing the distribution of the number of HLA class I, class II and non-HLA alleles known to date within the human MHC region. Data extracted from the IPD-IMGT/HLA database v.3.48, downloaded in July 2022. (B) Bar graphs depicting the distribution of the number of alleles, proteins and null alleles (characterized by the presence of truncating mutations), per locus among classical and non-classical HLA genes. Of note is that HLA-DRB1 is responsible for the greatest variability within the copy number-variable DRB locus. (C) 3D crystallographic structure of TCR αβ chains interacting with an MHC class I molecule (allele A*02:01 and β2 microglobulin – β2M). These structures were extracted from the Protein databank (PDB) website and reoriented in order to show MHC-TCR synapsis (ref PDB:4MNQ) (10). (D) Representation of the HLA binding motifs of selected epitopes from a HLA-A2 related dataset, extracted from the IEDB (11) an visualized with Weblogo (https://weblogo.berkeley.edu ) (E) Crystallographic structure of the antigen binding domains of HLA-A*01:01 with some variable residues highlighted. (F) WebLogo visualization of the variable amino acids within the peptide binding domains (corresponding to exon 2 and 3) of the HLA-A alleles in a representative population of healthy controls (N=960). (12) The height of each letter corresponds to the relative frequency of each amino acid in the population. This graphic represents an attempt to visualize the variability of the antigen binding domain of HLA-A alleles, but does not capture the whole spectrum of heterogeneity, since it represents only a limited population.

