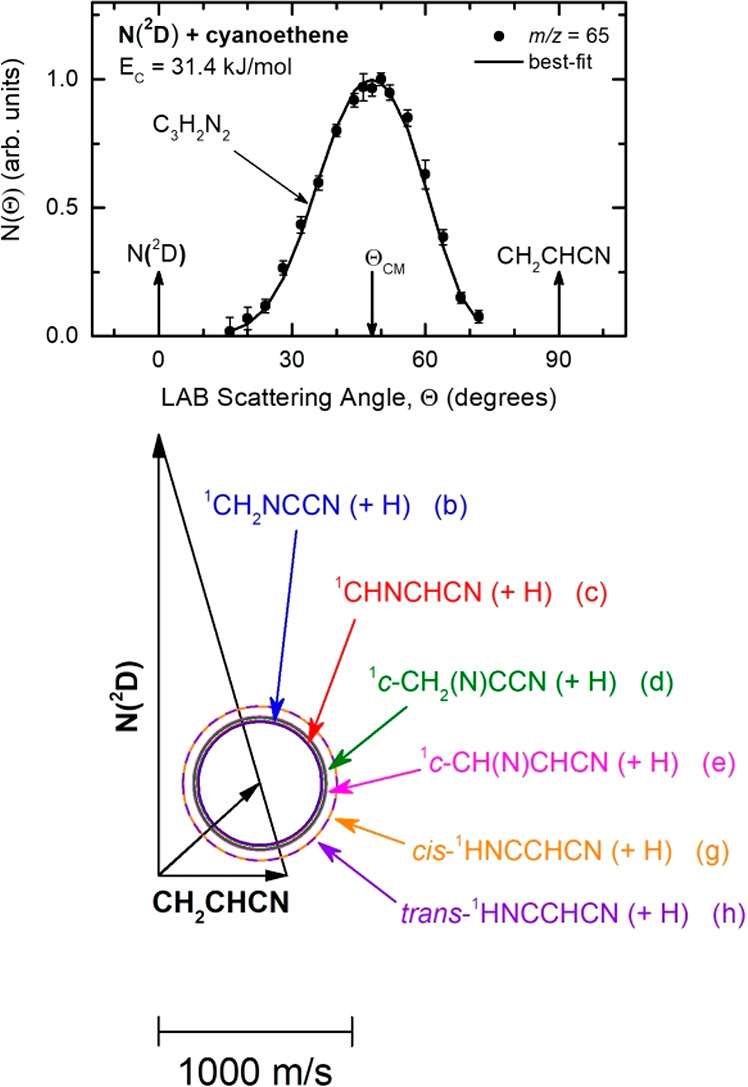
Figure 3.

(Top): LAB angular distribution of the C3H2N2 product detected at m/z = 65 (C3HN2+) for the N(2D) + vinyl cyanide reaction at Ec = 31.4 kJ/mol. The solid black curve represents the calculated distribution when using the best-fit CM functions shown in Figure 5. (Bottom): Velocity vector (Newton) diagram of the experiment. The radius of each circle represents the maximum velocity that the indicated product can attain in the center-of-mass (CM) reference frame if all available energy is channeled into product recoil energy (see text).
