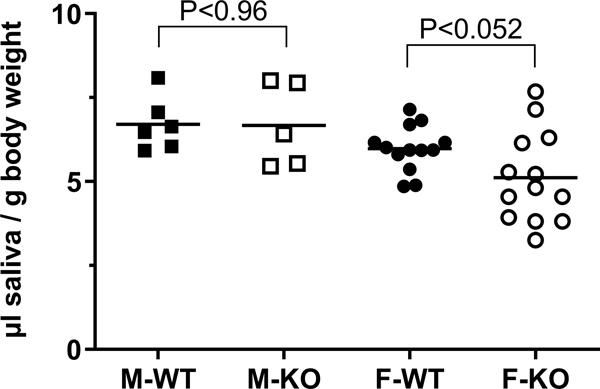
Fig. 4.
Saliva secretion. A. Pilocarpine-stimulated saliva was collected from male (M, squares) and female (F, circles), WT (closed symbols) and Bpifa2 KO (open symbols) mice. Saliva volume was expressed relative to body weight (µl saliva / g body weight). Data from two (M) or four (F) independent experiments are shown with the group means indicated by horizontal lines. WT and KO mice were compared by Student’s t-test for each sex (N=5–13).

