Fig 6.
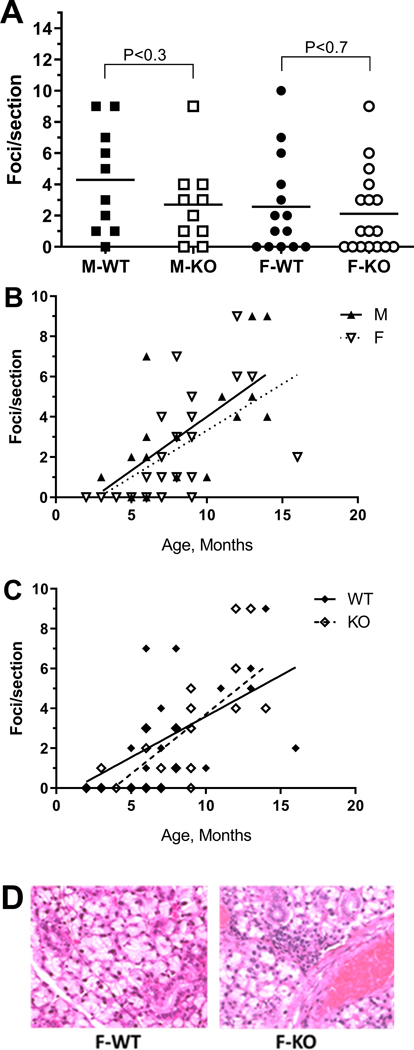
Inflammatory foci in submandibular gland. Hematoxylin and eosin-stained tissue sections were analyzed by light microscopy and foci of inflammatory cells (>50 cells) counted per section.
A. Foci per section for male (squares) and female (circles), WT (closed symbols) and KO mice (open symbols) glands. Data for individual mice are shown. The horizontal lines represent the group mean. WT and KO mice of each sex were compared by unpaired, two-tailed Student’s t-test. P-values are shown; N = 10–17.
B. Foci per section for WT and KO mice were combined for male (closed triangles) and female (open triangles) mice and expressed as a function of age. Linear regression slopes = 0.5; different from zero, P<0.003; N=19 (M) and P=0.0001; N=30 (F).
C. Foci per section for male and female mice were combined for WT (closed diamonds) and KO (open diamonds) mice and expressed as a function of age. Linear regression: slope = 0.4 (WT) and 0.6 (KO); different from zero, P<0.007; N=22 (WT) and P<0.0001; N=27 (KO).
D. Hematoxylin and eosin-stained section of submandibular glands from 4 month old female WT and KO mice.

