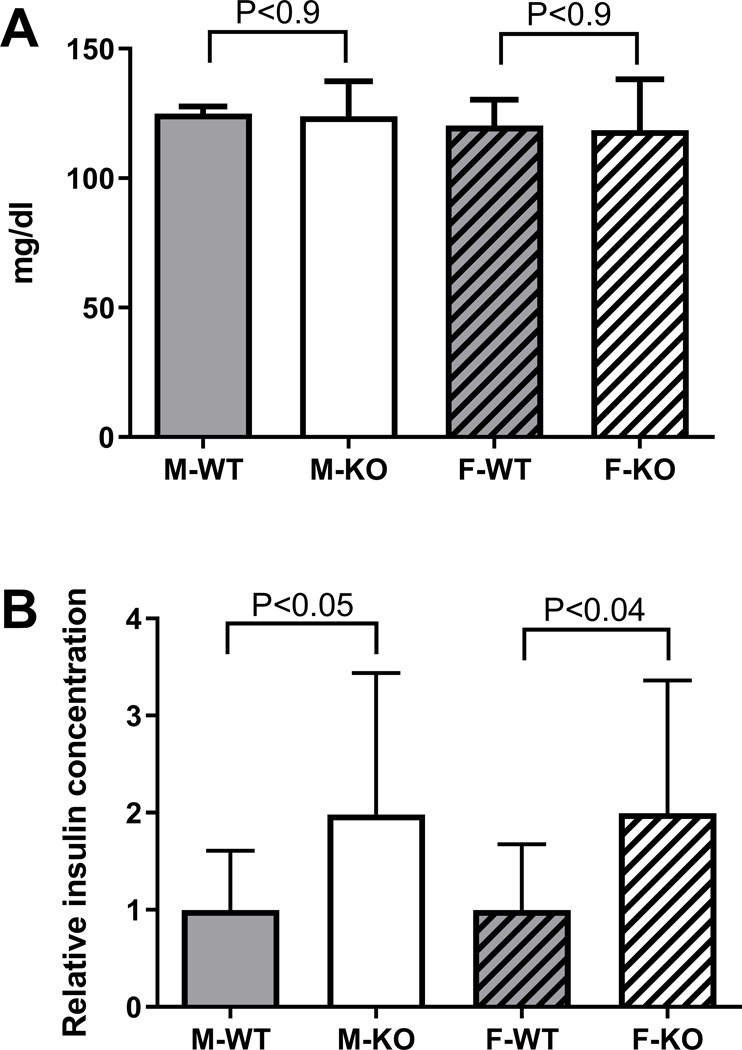
Fig. 9.
Glucose levels and insulin secretion. A. Blood glucose was determined in freshly collected blood from mice aged 6 months and expressed as mean ± SD, N=4. Similar results were obtained when the same mice were tested at ages 8–9 months (not shown). B. Relative insulin concentration in mouse serum. Data from three independent experiments were normalized to the mean of the WT group in each experiment for each sex and are shown as mean ± SD. N=12–13. In each panel, WT and KO mice of each sex were analyzed by unpaired, two-tailed Student’s t-test.

