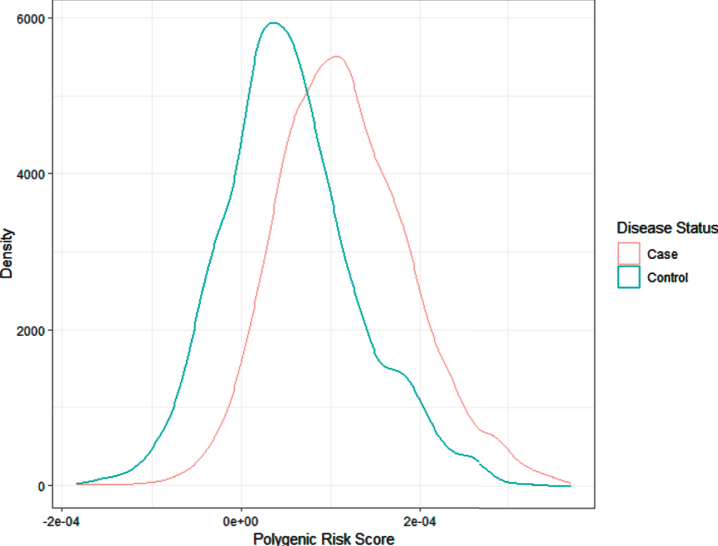
Fig. 1.
Alzheimer’s disease PRS distribution. PRS is typically normally distributed, as seen here, with cases shifted slightly right of controls due to higher genetic risk. In the best case it is able to discriminate between the groups of study. The PRS for this figure was calculated for samples (2635 cases, 2471 controls) from the National Alzheimer’s Coordinating Center (NACC) [55] using effect size estimates from the 2019 IGAP GWAS [36] summary statistics. The C+T method was implemented using PLINK software (code available upon request).

