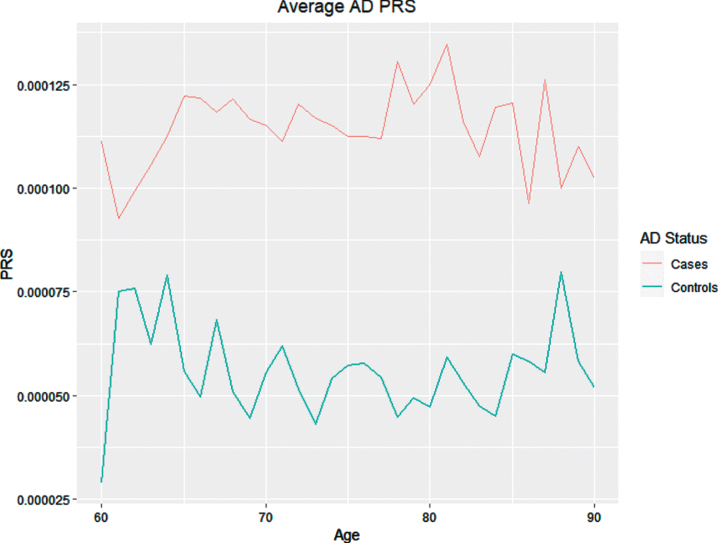
Fig. 3.
Average PRS for Alzheimer’s disease. Average Alzheimer’s disease PRS by age for cases (2635, red) and controls (2471, blue) from the National Alzheimer’s Coordinating Center (NACC) [55]. Risk scores were calculated using the C+T method in PLINK (code available upon request), using effect size estimates from the 2019 IGAP GWAS [36] summary statistics. Samples were grouped by age, with bin width = 1, with the exception of group 90 which includes all samples 90 years of age and older.

