FIGURE 2.

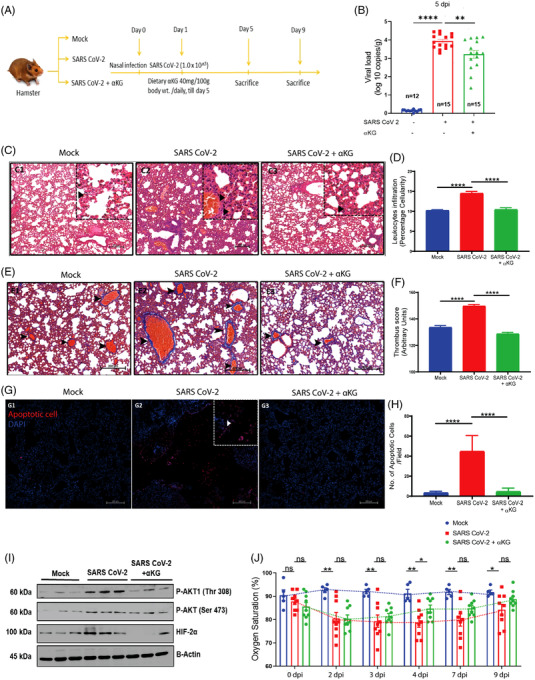
αKG rescues hamsters from SARS CoV‐2 infection and restores SpO2 in the circulation: (A) Hamsters were given SARS CoV‐2 infection via the nasal route and αKG was supplemented from 1 day post‐infection (dpi) and animals were sacrificed at 5 dpi and 9 dpi to measure the following parameters. (B) αKG reduced SARS CoV‐2 replication in lung at 5 dpi. Data are from 12 mock, and 15 infected and 15 infected+αKG groups. Each dot represents an individual value expressed as mean ± SEM (one‐way ANOVA using Sidak's post‐test), **p < .01 and ****p < .0001. (C, D) H&E staining of lung was used to assess leukocyte accumulation at 5 dpi. (D) Percentage cellularity score was calculated as mean ± SEM, from 10 fields from different animals and (one‐way ANOVA, using Bonferroni's post‐test **** p < .0001). Arrows indicate cell accumulation. Scale bar 250 mm. (E) MT staining of lung was used for assessing clot formation at 5 dpi; arrows indicate thrombus (F). Thrombus score is represented as mean ± SEM (one‐way ANOVA, using Bonferroni's post‐test *p < .05, ***p < .001 and **** p < .0001). Scale bar 200 mm. (G) TUNEL assay was used to assess apoptotic cells. αKG treatment reduced apoptosis in the lungs of infected hamsters at 5 dpi. (H) Quantification of apoptotic cells per field. 3X3 field captured at 20× magnification. Data are from 10 fields from different animals and represented as mean ± SEM (one‐way ANOVA, using Bonferroni's post‐test ****p < .0001) The above data for 9 dpi are described in Figure S3O and P. (I) Expression of pAkt1‐Thr308, pAkt‐Ser473 and HIF2α measured in SARS CoV‐2‐infected hamsters supplemented with αKG. Densitometry quantification from different animals is described in Figure S4R–T. (Kruskal‐Wallis test followed by Dunn's multiple comparison post‐test), *p < .05, **p < .01, ***p < .001, ****p < .0001, and ns = non‐significant. (J) Oxygen saturation in the circulation was measured in hamsters from mock (n = 5), infected and infected+αKG groups (n = 9 in each) using a pulse oximeter. Infected animals showed a significant decrease from 2 dpi till 9 dpi compared to mock. αKG showed a rescue effect from 4 dpi onwards. Data are represented as mean ± SEM (Student's t test, *p < .05 and ns = non‐significant)
