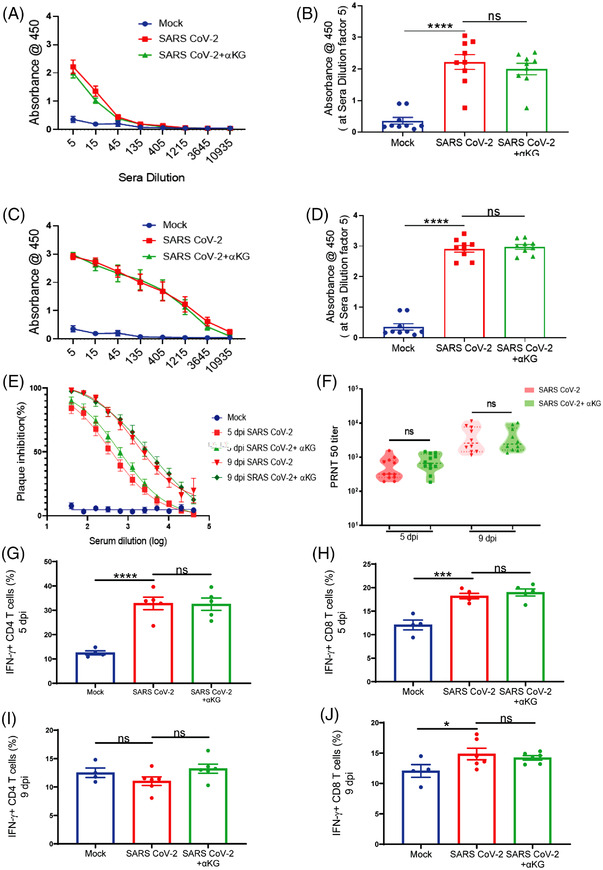
FIGURE 3.

αKG supplementation does not interfere with the anti‐viral response of T cells and IgG in SARS CoV‐2‐infected hamsters. Anti‐SARS RBD antibody quantification at increasing sera dilution showed no difference between infected and infected+αKG groups at 5 dpi (A) and 9 dpi (C). Absorbance at sera dilution 5 at 5 dpi (B) and 9 dpi (D). Data from 9 animals in each group are represented as mean ± SEM (one‐way ANOVA, using Bonferroni's post‐test, ****p < .0001 and ns = non‐significant). (E, F) Neutralization antibody was measured at increasing sera dilution using a PRNT50 assay showing no difference between the above groups at 5 dpi and 9 dpi. Data are represented as mean ± SEM (n = 12 in each group) at 5 dpi and (n = 10 in each group) at 9 dpi (one‐way ANOVA, ns = non‐significant). Flow cytometry analysis of IFNγ+ CD4 T‐cell percentage from spleen showing no difference between infected and infected+αKG groups at 5 dpi (G) and 9 dpi (I). Data are represented as mean ± SEM from 4 animals in mock, and 5 in infected and 5 in infected+αKG groups at 5 dpi, and 6 animals in infected and 6 in infected+αKG groups at 9 dpi (one‐way ANOVA, using Bonferroni's post‐test, ****p < .0001 and ns = non‐significant). Analysis of IFNγ+ CD8 T‐cell percentage showing no difference between groups at 5 dpi (H) and 9 dpi (J). Data are represented as mean ± SEM from 4 animals in mock, and 5 in infected and 5 in infected+αKG groups at 5 dpi, and 6 animals in infected and 6 in infected+αKG groups at 9 dpi (one‐way ANOVA, using Bonferroni's post‐test, *p < .05, ***p < .001 and ns = non‐significant)
