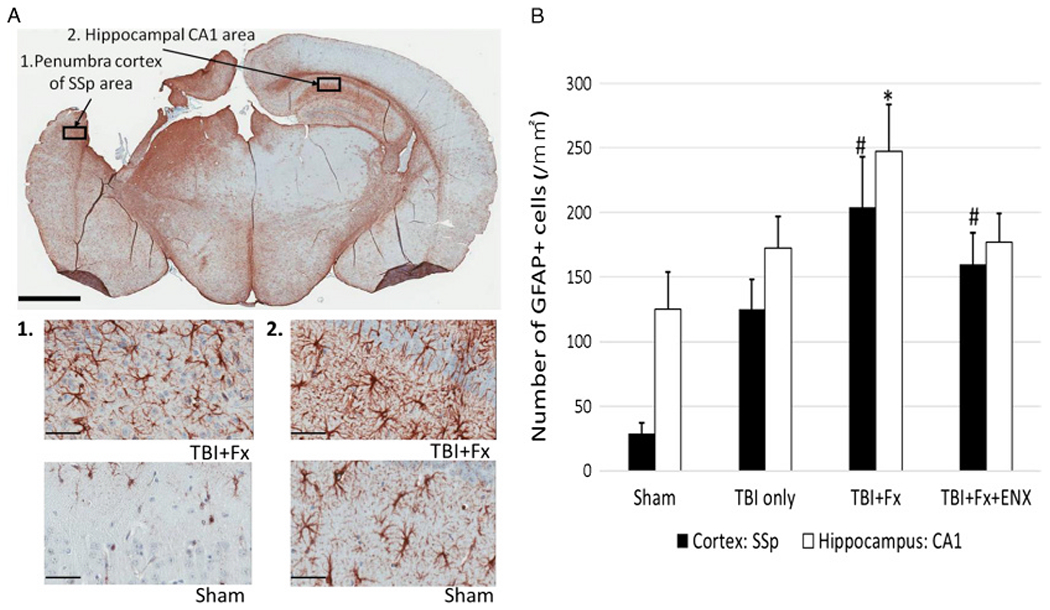
Figure 6.

Immunohistochemical analysis for GFAP on 17 days after TBI. (A) Representative image (20× magnification; scale bar = 2 mm) demonstrating GFAP immunoreactive astrocytes. 1, Representative image (400× magnification; scale bar = 50 μm) of GFAP-positive cells in penumbra cortex of the SSp area. 2, Representative image (400× magnification; scale bar = 50 μm) of GFAP-positive cells in hippocampal CA1 area. (B) TBI + Fx demonstrated greater GFAP-positive astrocytes than Sham in cortex and hippocampus. *p < 0.05, #p < 0.05 vs. Sham.
