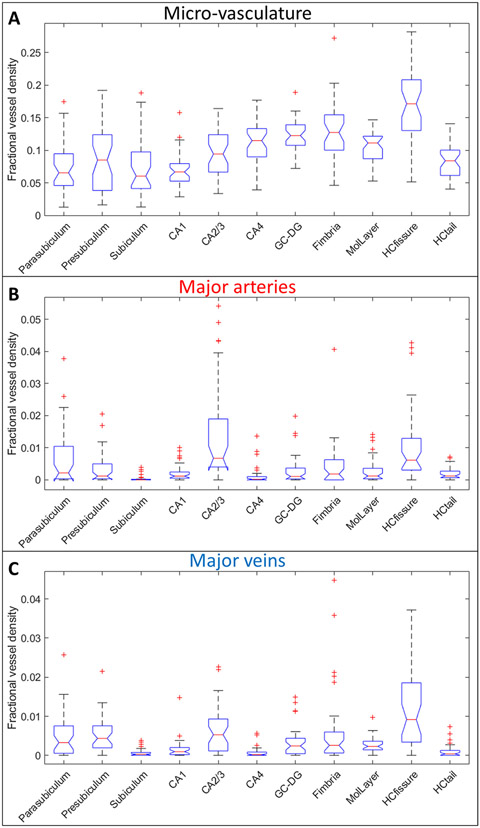
Fig. 4.
Boxplots of fractional vessel density (FVD) measures for the intra-hippocampal (A) micro-vasculature, (B) major arteries (using MRAnl) and (C) major veins (using MRVavg) for each of the subfields. The boxplots provide the median values in form of red lines, boxes across the interquartile range, and dotted bars across the 95% confidence interval regions. The significance in the differences across the various subfields are shown in Table S1. The values outside of this window are deemed as outliers and are plotted here as red + ’s. CA1, CA2/3, CA4 = Cornu Ammonis layers, GC-DG = Granule cell layer of the dentate gyrus, MolLayer = Molecular layer of hippocampus, HCfissure = hippocampal fissure, HCtail = hippocampal tail.

