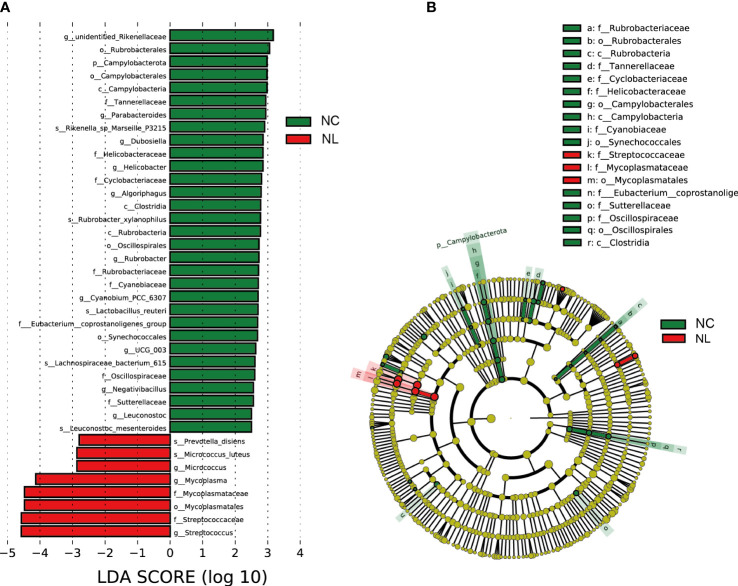
Figure 2.
Urinary microbiome differential analysis. (A) Difference in abundance estimated by linear discriminant analysis effect size (LEfSe) between the normal control (NC) and nephrolith (NL) groups. (B) Taxonomic cladogram presenting phylogenetic distribution of microbiota related to NC and NL groups. Threshold of linear discriminant analysis (LDA) greater than 2.5 are shown.

